| Sep 04, 2014 |
Researchers discover new clues to determining the solar cycle
|
|
(Nanowerk News) Approximately every 11 years, the sun undergoes a complete personality change from quiet and calm to violently active. The height of the sun’s activity, known as solar maximum, is a time of numerous sunspots, punctuated with profound eruptions that send radiation and solar particles out into the far reaches of space.
|
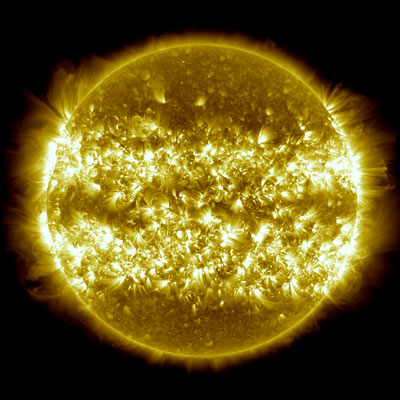 |
| A composite of 25 separate images from NASA's SDO, spanning one year from April 2012 to April 2013. The image reveals the migration tracks of active regions towards the equator during that period. (Image: NASA/SDO/Goddard)
|
|
However, the timing of the solar cycle is far from precise. Since humans began regularly recording sunspots in the 17th century, the time between successive solar maxima has been as short as nine years, but as long as 14, making it hard to determine its cause. Now, researchers have discovered a new marker to track the course of the solar cycle—brightpoints, little bright spots in the solar atmosphere that allow us to observe the constant roiling of material inside the sun. These markers provide a new way to watch the way the magnetic fields evolve and move through our closest star. They also show that a substantial adjustment to established theories about what drives this mysterious cycle may be needed.
|
|
Historically, theories about what's going on inside the sun to drive the solar cycle have relied on only one set of observations: the detection of sunspots, a data record that goes back centuries. Over the past few decades, realizing that sunspots are areas of intense magnetic fields, researchers have also been able to include observations of magnetic measurements of the sun from more than 90 million miles away.
|
|
"Sunspots have been the perennial marker for understanding the mechanisms that rule the sun's interior," said Scott McIntosh, a space scientist at the National Center for Atmospheric Research in Boulder, Colorado, and first author of a paper on these results that appears in the September 1, 2014, issue of the Astrophysical Journal. "But the processes that make sunspots are not well understood, and far less, those that govern their migration and what drives their movement. Now we can see there are bright points in the solar atmosphere, which act like buoys anchored to what's going on much deeper down. They help us develop a different picture of the interior of the sun."
|
|
Over the course of a solar cycle, the sunspots tend to migrate progressively lower in latitude, moving toward the equator. The prevailing theory is that two symmetrical, grand loops of material in each solar hemisphere, like huge conveyor belts, sweep from the poles to the equator where they sink deeper down into the sun and then make their way steadily back to the poles. These conveyor belts also move the magnetic field through the churning solar atmosphere. The theory suggests that sunspots move in synch with this flow – tracking sunspots has allowed a study of that flow and theories about the solar cycle have developed based on that progression. But there is much that remains unknown: Why do the sunspots only appear lower than about 30 degrees? What causes the sunspots of consecutive cycles to abruptly flip magnetic polarity from positive to negative, or vice versa? Why is the timing of the cycle so variable?
|
|
Beginning in 2010, McIntosh and his colleagues began tracking the size of different magnetically balanced areas on the sun, that is, areas where there are an equal number of magnetic fields pointing down into the sun as pointing out. The team found magnetic parcels in sizes that had been seen before, but also spotted much larger parcels than those previously noted -- about the diameter of Jupiter. The researchers also looked at these regions in imagery of the sun's atmosphere, the corona, captured by NASA’s Solar Dynamics Observatory, or SDO. They noticed that ubiquitous spots of extreme ultraviolet and X-ray light, known as brightpoints, prefer to hover around the vertices of these large areas, dubbed “g-nodes” because of their giant scale.
|
|
These brightpoints and g-nodes, therefore, open up a whole new way to track how material flows inside the sun. McIntosh and his colleagues then collected information about the movement of these features over the past 18 years of available observations from the joint European Space Agency and NASA Solar and Heliospheric Observatory and SDO to monitor how the last solar cycle progressed and the current one started. They found that bands of these markers – and therefore the corresponding large magnetic fields underneath – also moved steadily toward the equator over time, along the same path as sunspots, but beginning at a latitude of about 55 degrees. In addition, each hemisphere of the sun usually has more than one of these bands present.
|
|
|
|
Bands of magnetized solar material – with alternating south and north polarity – march toward the sun's equator. Comparing the evolution of the bands with the sunspot number in each hemisphere over time may change the way we think about what's driving the sun's 11-year sunspot cycle. (Image: S. McIntosh)
|
|
McIntosh explains that a complex interaction of magnetic field lines may take place in the sun’s interior that is largely hidden from view. The recent observations suggest that the sun is populated with bands of differently polarized magnetic material that, once they form, steadily move toward the equator from high latitudes. These bands will either have a northern or southern magnetic polarity and their sign alternates in each hemisphere such that the polarities always cancel. For example, looking at the sun’s northern hemisphere, the band closest to the equator – perhaps of northern polarity – would have magnetic field lines that connect it to another band, at higher latitudes, of southern polarity. Across the equator, in the bottom half of the sun, a similar process occurs, but the bands would be an almost mirror image of those across the equator, southern polarity near the equator and northern at higher latitudes. Magnetic field lines would connect the four bands; inside each hemisphere and across the equator as well.
|
|
While the field lines remain relatively short like this, the sun's magnetic system is calmer, producing fewer sunspots and fewer eruptions. This is solar minimum. But once the two low-latitude marching bands reach the equator their polarities essentially cancel each other out. Abruptly they disappear. This process, from migratory start to finish at the equator takes 19 years on average, but is seen to vary from 16 to about 21 years.
|
|
Following the equatorial battle and cancellation, the sun is left with just two large bands that have migrated to about 30 degrees latitude. The magnetic field lines from these bands are much longer and so the bands in each hemisphere feel less of each other. At this point, the sunspots begin to grow rapidly on the bands, beginning the ramp-up to solar max. The growth only lasts so long, however, because the process of generating a new band of opposite polarity has already begun at high latitudes. When that new band begins to appear, the complex four-band connection starts over and the number of sunspots starts to decrease on the low-latitude bands.
|
|
In this scenario, it is the magnetic band’s cycle – the lifetime of each band as it marches toward the equator – that truly defines the entire solar cycle. “Thus, the 11-year solar cycle can be viewed as the overlap between two much longer cycles,” said Robert Leamon, co-author on the paper at Montana State University in Bozeman and NASA Headquarters in Washington.
|
|
The new conceptual model also provides an explanation of why sunspots are trapped below 30 degrees and abruptly change sign. However, the model creates a question about a different latitude line: Why do the magnetic markers, the brightpoints and g-nodes, start appearing at 55 degrees?
|
|
"Above that latitude, the solar atmosphere appears to be disconnected from the rotation beneath it," said McIntosh. "So there is reason to believe that, inside the sun, there's a very different internal motion and evolution at high latitudes compared to the region near the equator. 55-degrees seems to be a critical latitude for the sun and something we need to explore further."
|
|
Solar cycles theories are best tested by making predictions as to when we will see the next solar minimum and the next solar maximum. This research paper forecasts that the sun will enter solar minimum somewhere in the last half of 2017, with the sunspots of the next cycle appearing near the end of 2019.
|
|
"People make their predictions for when this solar cycle will end and the next one will start," said Leamon. "Sometime in 2019 or 2020, some people will be proved right and others wrong."
|
|
In the meantime, regardless of whether the new hypothesis provided by McIntosh and his colleagues is correct, this long term set of bright points and g-node locations offers a new set of observations to explore the drivers of solar activity beyond only sunspots. Inserting this information into solar models will provide an opportunity to improve simulations of our star. Such advanced models tell us more about other stars too, leading to a better understanding of similar magnetic activity on more exotic, distant celestial counterparts.
|