| Posted: Dec 30, 2013 | |
Toward quantitative nanomechanical measurements on live cells |
|
| (Nanowerk Application Note) Measuring and mapping mechanical properties of live cells is of high importance in today’s biological research. Atomic force microscopy1 has been recognized since the mid-eighties as an excellent technique to image a wide range of samples in their near-natural environment. Although the primary function of atomic force microscopy is to generate a three-dimensional (3D) profile of the scanned surface, much more information is available through the technique. TappingMode™, which was developed in 1993,2 prevents tip and sample damage from friction and shear forces, and allows qualitative mechanical property mapping through phase imaging. Around the same time, force spectroscopy,3 and force volume4 were developed to study tip-sample forces at a point, or over an area respectively. Traditionally, force spectroscopy and force volume are the most commonly used modes to quantitatively measure mechanical forces at the nanometer scale. Unfortunately, both techniques have suffered from slow acquisition speed and a lack of automated tools to analyze the hundreds to thousands of curves required for good statistics. | |
| The recent release of PeakForce QNM® resolves these limitations and can provide better results in terms of resolution, speed, ease-of-use, and quality of delivered information.5 PeakForce QNM is based on Bruker’s PeakForce Tapping™ mode, which oscillates the probe at about 1kHz, and which uses the peak force (maximum nominal force applied to the sample) for feedback control. Each time the tip interacts with the sample, a force curve is collected and analyzed by PeakForce QNM. The resulting signals are extracted and quantitatively displayed as a falsecolored image in real-time. Currently available data types include peak force, adhesion, Young’s modulus, deformation and dissipation. This mode has been successfully tested on a wide range of samples,6 from bio-polymers7,8 and live eukaryotic cells9 to human models.10 | |
| This application note reviews recent progress in mapping the properties of soft samples such as cells and gels with force volume and PeakForce QNM and the use of the newest NanoScope® and NanoScope Analysis features to collect and analyze the data from these techniques. | |
| Force Volume and PeakForce QNM: Speed and Flexibility | |
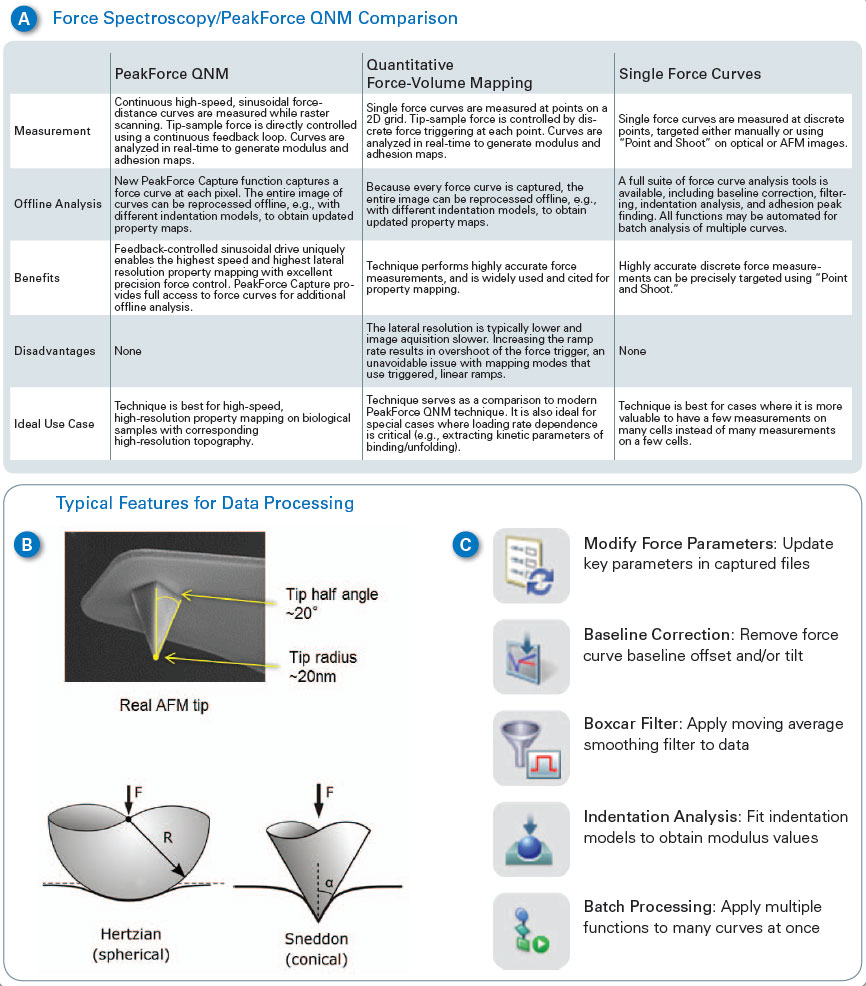
| Force spectroscopy, force volume and PeakForce QNM are all useful methods for studying cell mechanics. Figure 1A summarizes the characteristics of each technique and compares their principle benefits and drawbacks. PeakForce QNM is best for high-resolution imaging or relatively high-speed imaging where material properties are of interest. Force volume is useful as a comparison to PeakForce QNM and for cases where the loading rate dependence of the measurement is important (such as studies of viscoelastic behavior and kinetic binding or unfolding measurements). Single force spectra are best for situations where mapping is not as important, where there are only a few points of interest in a sample, or where force measurements need to be separated by some distance to avoid interaction from one measurement to the next. The key differences between PeakForce QNM and force volume (or force spectroscopy) are: | |
|
|
|
| For these reasons, PeakForce QNM is significantly better for material property mapping than force volume in most cases. On the other hand, force volume and force spectroscopy allow more control of the details of the ramp, such as independent control of approach and retract tip velocity and surface hold. Also, force volume and force spectroscopy taps can be separated by some distance since the triggering is treated independently, while PeakForce QNM taps must be close together to achieve the best feedback performance. | |
| Figure 1 also describes some of the new features of Bruker’s recently introduced Nanomechanics package. This package adds key functionality that allows users to easily bridge between the techniques of PeakForce QNM, force volume and single force spectra, while adding some important capabilities for working with soft materials such as cells. For PeakForce QNM, the nanomechanics package adds the capability to work at a wider range of frequencies and amplitudes. This is useful for working in fluid (smaller frequencies and amplitudes reduce viscous drag on the cantilever) and for very soft samples (where larger amplitudes may be needed). In response to numerous requests from the research community, the Sneddon cone model of elastic deformation was also added.11 This allows calculation of modulus based on a conical or pyramidal tip shape instead of the parabolic (spherical) tips of the DMT model. On very soft samples (e.g., cells, tissues, biomolecules), the tip often indents well past the part that can be approximated by a sphere (see Figure 1B), even with the best force control. Thus, the Sneddon model is often more appropriate for biological samples. Finally, PeakForce Capture™ adds the capability to simultaneously save a force curve at every pixel in the image while collecting PeakForce QNM material property maps. The data is saved in a force volume type file, enabling easy comparison to force volume images with the same analysis functions. Data channels can be recalculated with different parameters (deflection sensitivity, etc.) or models, or individual curves can be examined and compared. | |
 |
|
| Figure 1. (A) Comparison of force volume, PeakForce QNM and single-force measurements. (B) Typical AFM tip– often neither a sphere nor a cone perfectly describe its shape. Comparison between Hertzian (DMT) sphere and Sneddon cone models of elastic deformation. (C) Nanomechanics features in NanoScope Analysis enable the user to modify the force parameters, flatten the baseline when necessary, and choose between various models depending on the nature of the tip and sample. (click image to enlarge) | |
| For force volume, it is now possible to obtain maps of DMT modulus, Sneddon modulus, adhesion, and peak force in real-time in addition to the traditional force slice. This provides immediate confirmation that the experiment is going well, or needs adjustment, without time consuming offline analysis. Once the data is collected, the offline analysis view allows the material properties to be recalculated with different parameters (deflection sensitivity, etc.) or models, or individual curves can be examined, compared, and exported to the single curve format. | |
| Some new tools are also available for single force spectra (see Figure 1C). Modify force parameters allows the calibration of individual curves to be adjusted. Baseline correction and Boxcar filter allow the curves to be filtered to correct artifacts such as offset, tilt, and noise. Indentation analysis allows fitting of the curves with either DMT model or Sneddon with options to include adhesion, use approach or retract, etc. All of these functions can be automated to easily analyze hundreds or thousands of curves and generate reports with statistics or histograms of data. Finally, for more complex analysis, a new MATLAB toolbox allows MATLAB to directly access NanoScope data files, freeing researchers to focus on modeling and results instead of worrying about file parsing or ASCII exports. | |
| The new nanomechanics package provides all of the tools necessary for easy comparison between the different techniques, to test different models, and to explore time dependence of the tip-sample interaction. This can be done either at a single point or in a map of the variation in material properties across a sample surface. | |
| Continue to next page (2 of 4) | |
|
|
|
|
Become a Spotlight guest author! Join our large and growing group of guest contributors. Have you just published a scientific paper or have other exciting developments to share with the nanotechnology community? Here is how to publish on nanowerk.com. |
|