3-D imaging technique maps migration of DNA-carrying material at the center of cells (w/video)
(Nanowerk News) Scientists have mapped the reorganization of genetic material that takes place when a stem cell matures into a nerve cell. Detailed 3-D visualizations show an unexpected connectivity in the genetic material in a cell’s nucleus, and provide a new understanding of a cell’s evolving architecture.
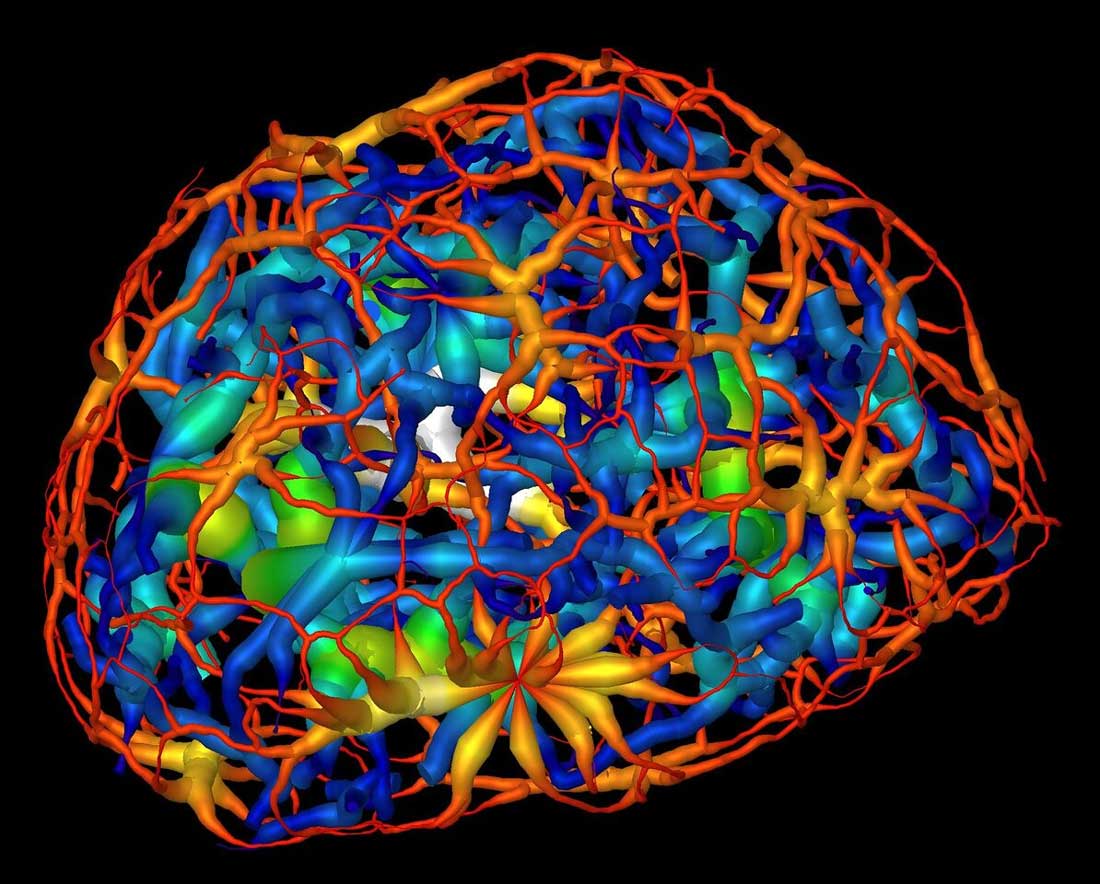
This computer rendering shows the skeletonized structure of heterochromatin (red represents a thin region while white represents a thick region), a tightly packed form of DNA, surrounding another form of DNA-carrying material known as euchromatin (dark blue represents a thin region and yellow represent the thickest) in a mouse’s mature nerve cell. (Image: Berkeley Lab, UCSF) (click on image to enlarge)
These unique 3-D reconstructions of mouse olfactory cells, which govern the sense of smell, were obtained using X-ray imaging tools at the Department of Energy’s Lawrence Berkeley National Laboratory (Berkeley Lab). The results could help us understand how patterning and reorganization of DNA-containing material called chromatin in a cell’s nucleus relate to a cell’s specialized function as specific genes are activated or silenced.
Chromatin is compacted to form chromosomes, which pass along an organism’s genetic fingerprint to newly formed cells during cell division.
This animation shows a 3-D rendering of a nucleus in a mouse cell known as a “neuronal progenitor.” The view shown here slices from the surface of the nucleus through to its other side, and is color-coded for two types of genetic material: heterochromatin (blue) and euchromatin (green). The gold color represents mitochondria, the energy production center in cells. Heterochromatin is believed to be the most tightly packed form of chromatin. Neuronal progenitor cells resemble stem cells in that they have the ability to specialize into different cell types, though with a more limited range of differentiation. (Video: Berkeley Lab, UCSF)
Researchers used a powerful X-ray microscope at Berkeley Lab’s Advanced Light Source (ALS) to capture images of nerve cell samples at different stages of maturity as they became more specialized in their function—this process is known as “differentiation.” Cells at each stage were imaged from dozens of different angles using X-rays. Each set of 2-D images was used to calculate a 3-D reconstruction of a cell detailing the changing chromatin formations in the nuclei.
They also were able to measure the dense packing in a form of chromatin called heterochromatin, and they learned about the importance of a specific protein in controlling the compaction of heterochromatin and its confinement to the nucleus.
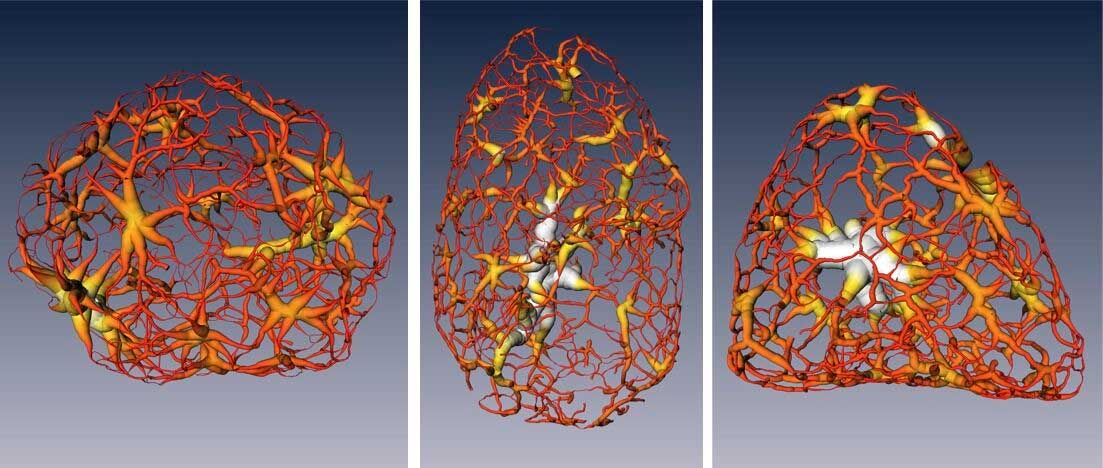
These renderings show a tightly packed form of DNA called heterochromatin as it exists in a mouse cell’s nucleus at different stages of cell development: a multipotent stem cell (left), a neuronal progenitor (middle), and a mature nerve cell (right). (Image: Berkeley Lab, UCSF) (click on image to enlarge)
“It’s a new way of looking at the nucleus where we don’t have to chemically treat the cell,” said Carolyn Larabell, director of the National Center for X-ray Tomography (NCXT), a joint program of Berkeley Lab and UC San Francisco (UCSF). “Being able to directly image and quantify changes in the nucleus is enormously important and has been on cell biologists’ wish list for many years.”
Chromatin is “notoriously sensitive,” she said, to chemical stains and other chemical additives that are often used in biological imaging to highlight regions of interest in a given sample. “Until now, it has only been possible to image the nucleus indirectly by staining it, in which case the researcher has to take a leap of faith that the stain was evenly distributed.”
Larabell, a faculty scientist in the Molecular Biophysics and Integrated Bioimaging Division at Berkeley Lab and a UCSF professor, said it was previously thought that chromatin existed as a series of disconnected islands, though the latest study showed how the chromatin is compartmentalized into two distinct regions of “crowding” that form a continuous network throughout the nucleus.
“We were really surprised: There are no islands, it’s all connected,” she said, adding, “We could see how chromatins pack through the nucleus and how molecules move through the nucleus, and we found that heterochromatin is 30 percent more crowded than the region where active genes are. That cannot be done with any other imaging techniques.” Two-dimensional images would have shown the nucleus as a “flat, confusing mess,” she said.
This computerized animation shows the skeletonized structure of heterochromatin, a tightly packed form of DNA, in a mouse’s mature olfactory neuron. Red denotes a small minimum distance, or thin region, of a branch of the heterochromatic structure, and white denotes a large minimum distance, or thick region, of a branch of the heterochromatin. (Video: Berkeley Lab, UCSF)
One aim of the latest study was to gain new insight into gene expression in mice specific to olfactory genes. Mice have about 1,500 genes related to smell. Each olfactory nerve cell expresses just one of these olfactory genes to produce a receptor that recognizes a related set of odors. The many receptors in a mouse’s nasal cavity allow it to detect a wide range of smells.
“We’re trying to understand how the reorganization of chromatin affects gene expression,” Larabell said. “No one’s been able to study this at the human level yet.” This research will hopefully lead to new insights about diseases and disorders that relate to gene expression. Already, the study’s results are being incorporated into models of cell development.
One of the precursors to Alzheimer’s disease, which attacks the brain’s nerve cells, is a loss of smell, so understanding this connection to olfactory nerve cells could perhaps serve as a diagnostic tool and perhaps unlock a deeper understanding of the degenerative disorder.
The latest study used a microscopy technique known as soft X-ray tomography to record a series of images from small groups of dozens of frozen olfactory nerve cells in three separate stages of development. The technique, which is unique to Berkeley Lab’s ALS, captured details as small as tens of nanometers, or tens of billionths of a meter. Researchers visually distinguished regions of highly compacted heterochromatin from other chromatin types.
This visualization shows tightly-packed DNA in a mouse cell’s nucleus at different stages of development, seen here in a semi-triangular form as a mature nerve cell; in a roundish shape as a multipotent stem cell; in a more oval form as a neuronal progenitor; and as a more fragmented structure that shows how removing a specialized binding protein (HP1β knockout) affects the structure of the DNA-packing material, called heterochromatin, in a mature neuron. (Video: Berkeley Lab, UCSF)
With the proven success of the imaging technique, Larabell said it’s possible to perform statistical analyses based on large collections of cell nuclei images sorted by different stages of development. Coupled with other types of imaging techniques, researchers hope to isolate individual gene-selection processes in upcoming work.
“This work highlights the power of multidisciplinary research,” said Mark Le Gros, associate director of the NCXT and a physicist who was responsible for the design and construction of the X-ray microscope. Le Gros, the lead author in this research, added, “This is an example of work that required a combination of molecular biologists and cell biologists with physicists and computer scientists.”