| Posted: Dec 21, 2016 |
How to tell when a nanoparticle is out of shape
(Nanowerk News) Nanoparticles -- those with diameters less than one-thousandth the width of a human hair -- are increasingly prevalent in high technology, medicine, and consumer goods.* Their characteristics, both desirable and undesirable, depend critically on their size.
|
|
For example, a nanoparticle (NP) in the bloodstream that is 50 nanometers (nm, billionths of a meter) wide may have limited effect on the cells it encounters; but a 20 nm version of exactly the same material can be toxic. Size considerations are especially important if, as anticipated, NPs come to play a major role in cancer therapy.** As a result, accurate measurements of a particle’s volume are essential.
|
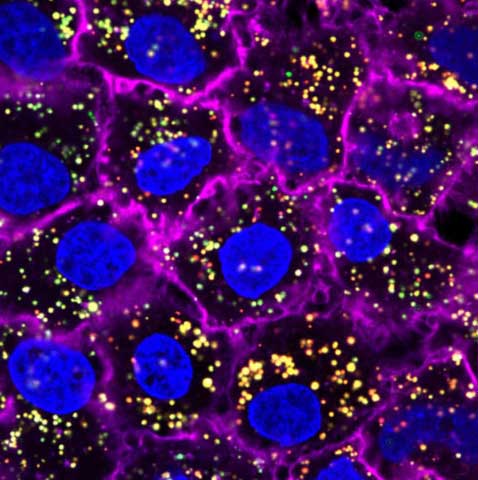 |
| Nanoparticles (yellow) targeting and entering cancer cells (blue). (Image: NIH)
|
|
But the volume measured using different tools can vary substantially. For example, a new analysis by scientists at NIST (Analytical and Bioanalytical Chemistry, "Volume determination of irregularly-shaped quasi-spherical nanoparticles") has shown that when the same set of NPs is measured with the two most widely used reference methods, calculated volume estimates can differ by as much as 160% owing to inherent biases in each method. To rectify that situation, the researchers have proposed and tested a novel combined measurement scheme that can minimize errors while still maintaining high measurement throughput.
|
|
“For a long time, even though many people were working on this problem, there have been different answers from the different methods and nobody seemed to know what method was correct or what is the correct size of nanoparticles,” says Ravikiran Attota, who headed the research.
|
|
The core of the problem is that assumptions are made while measuring the volume of NPs, especially irregularly-shaped NPs (IS-NPs). In addition, NP volume is only rarely measured directly.*** Instead, three-dimensional size is typically extrapolated. Widely used reference tools such as scanning electron microscopy (SEM) and atomic force microscopy (AFM) measure volume by using very different methods.
|
|
In SEM, a focused beam of electrons is scanned across the particle from above to produce a 2D image of length and width. This top-down approach cannot determine a particle’s height, which is assumed to be approximately the same magnitude as the other two dimensions.
|
|
In the AFM method, a sharp probe is moved over the NP to record only its peak height, not the width or length, which are assumed to be approximately the same.
|
|
In either case, the data are fed into an algorithm that calculates the volume that the particle would have if it were a perfect sphere.
|
|
Measurements of the same batch of particles differ significantly depending on which of the two methods is used, and that discrepancy is a notorious predicament in nanoscience. The NIST researchers found that each method has a distinctive bias because results are influenced both by the position in which NPs come to rest on the surface upon which they are measured, and by the nature of the measurement.
|
|
Unless the particles are perfectly spherical, SEM measurements typically produce larger values for particle diameter, and the difference between SEM and AFM measurements becomes greater the more that the IS-NP shape deviates from a sphere. For example, an IS-NP shaped like a hamburger bun -- that is, much wider than it is high -- will look larger from the top-down SEM perspective than it will from the height-only AFM perspective.
|
|
In order to achieve the lowest error in volume estimates—the scientists at NIST propose—measurements should be made using both SEM and AFM techniques to produce a more accurate 3D shape. (See diagram.) After testing the idea in models and simulations with computer-generated shapes, they used an assortment of 54 irregularly shaped glass aquarium pebbles whose volume could be determined exactly. Employing the combination measurement technique to calculate volume produced values that differed less than 1% from the actual measured volume.
|
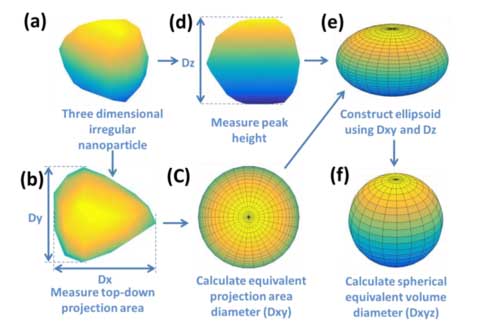 |
| The combination method for determining nanoparticle volume involves measuring both the width and length using top-down SEM imaging to get a diameter reading (a, b, c), measuring the height using AFM (d, e) and then combining the readings to calculate the volume (f).
|
|
The researchers then applied the technique to actual SEM and AFM measurements made on the same gold nanoparticles with diameters around 50 nm. The results were in good agreement with the simulations and pebble experiments, although limited by the fact that SEM measurements cannot exactly detect the edges of gold nanoparticles. The scientists speculate that a related technology, called transmission electron microscopy, which has more precise edge discrimination, may alleviate the problem.
|
|
“The discrepancies between measurement values coming from the different available techniques has been a long-standing headache for serious metrologists, especially as the dimensions get smaller,” says John Kramar, a Group Leader at NIST. “Using this technique will help us to produce much more accurate nanoparticle reference materials.”
|
|
Notes
|
|
* In October, 2016, The White House Office of Science and Technology Policy stated that “Revenue from the sale of nanotechnology-enabled products in the United States has grown more than six-fold from 2009 through 2016 and is projected to exceed $500 billion in 2016.” Many of those products contain nanoparticles, defined as a particle less than 100 nanometers in diameter.
|
|
** Numerous treatment possibilities are being explored. The National Cancer Institute maintains a laboratory to “characterize nanoparticles' physical attributes, their in vitro biological properties, and their in vivo compatibility using animal models.”
|
|
*** There is a technique, called electron tomography, which produces a 3D measurement. It entails shooting a stream of electrons at an NP from a variety of angles, measuring the electrons that pass through the particle at each angle, and then using a software algorithm that combines all the measurements into a 3D structure. However, it is time-consuming and impractical for use in most applications.
|

