| Jul 29, 2019 |
Transforming advanced nanoscience data into interactive art(Nanowerk News) It is hard to imagine just how small one nanometer—one-billionth of a meter—really is. Ten hydrogen atoms in a row are one nanometer long. For perspective, consider that a sheet of paper is 75,000 nanometers thick. A red blood cell is 7,000 nanometers across. A typical virus is about 100 nanometers wide, and a strand of DNA is two nanometers wide. |
| To see at the atomic and molecular scale, scientists use instruments such as atomic force microscopes that “feel” surfaces with a mechanical probe, electron microscopes that scan a highly focused beam of electrons across a sample, and x-ray scattering instruments that direct x-rays at a sample surface. With these instruments, scientists can probe the crystal structure, chemical composition, and electronic nature of materials. Understanding these properties is key to designing and optimizing materials with the desired functions for particular applications. |
| However, modern-day experiments are producing data of a highly complex and abstract nature. Thus, data interpretation can be difficult. |
| “We have some exquisite methods for reconstructing three-dimensional (3-D) structures at the nanoscale,” said physical chemist Kevin Yager, leader of the Electronic Nanomaterials Group at the Center for Functional Nanomaterials (CFN)—a U.S. Department of Energy (DOE) Office of Science User Facility at Brookhaven National Laboratory. “But even if you’ve measured the structure perfectly, you haven’t learned anything until you understand how the components are organized. New visualization and sonification methods can really help provide this understanding.” |
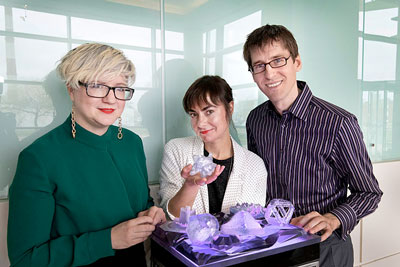 |
| Multimedia artist Melissa Clarke (center) made more than a dozen 3-D printed glass-like sculptures based on nanoscience data collected by scientists at Brookhaven Lab's Center for Functional Nanomaterials (CFN) and National Synchrotron Light Source II, including CFN physicist Kevin Yager (right). For the virtual reality (VR) component of the project, viewers can walk through and interact with the sculptures by wearing a VR headset. During the immersive experience, different sonifications created by Margaret Schedel (left)—a professor of computer music at Stony Brook University—play as the user performs various actions. |
Data sonification |
| Over the past several years, Yager and Margaret Schedel—an associate professor in the Department of Music at Stony Brook University (SBU), where she is also the co-director of the computer music program and an affiliate faculty member at the Institute for Advanced Computational Science—have been combining their expertise to convert x-ray scattering data of nanomaterial structures into sound. To capture these data, Yager uses the Complex Materials Scattering and Soft Matter Interfaces beamlines at the National Synchrotron Light Source II (NSLS-II), another DOE Office of Science User Facility at Brookhaven Lab. These two beamlines are partner instruments jointly operated by the CFN and NSLS-II. |
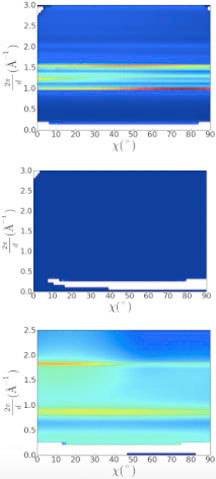 Different materials produce vastly different corresponding sounds. From top to bottom: a commercial plastic, a misaligned sample (beam missed the sample), and a composite of carbon nanotubes dispersed in an elastic polymer. For example, the commercial plastic has many striations (scattering rings, which arise from the diffraction of x-rays from the sample's internal structure) because of its semi-crystalline packing, leading to several distinct tones over time. “I knew that Kevin shoots x-rays at nanoparticles to understand their structure but spends most of his day programming computers,” said Schedel. “One day, I asked him how it all works. He said that x-rays bounce off the atoms in a sample and are recorded by a detector. From that scattering pattern, he can compute the structure of the material with the fast Fourier transform (FFT) algorithm. He started explaining what FFT is, but I stopped him because it is the same algorithm that I use all the time in my computer music work.” The FFT algorithm is a mathematical tool used to represent any periodic function as a sum of sine waves. In Yager’s case, the periodic function is the arrangement of atoms in the material; for Schedel, it is sounds produced over time. “In computer music, we use a technique called additive synthesis to combine sound waves together,” said Schedel. “In a similar way, x-ray scattering data can easily be represented as sound. Kevin provides me with x and y coordinates and brightness information from the x-ray scattering detector, and I turn that information into sine waves, with the pitches (frequency of sound wave) based on the positions and the loudness (amplitude of sound wave) based on the intensity.” In this case, different qualities of the structures map to different sound qualities, or tones (“timbre”). For example, metallic samples with tightly packed atoms have a higher-pitched sound than materials with spaced-out atoms. Similarly, well-ordered crystalline structures have clear and distinct pitches, while polymers such as plastics generate chaotic noise. At first, Yager was skeptical that sonified data could be useful. But after he heard nuances that correlated with a misaligned sample, he changed his mind. As described in a paper they published in 2012 ("Hearing Nano-Structures: A Case Study in Timbral Sonification"), data sonification could not only help scientists identify instrument errors during data collection but also enable them to better understand highly abstract datasets, simultaneously perform other tasks, and extract insights that had been overlooked during visual analysis. Schedel and Yager are also trying to apply machine learning algorithms for computer vision and music information retrieval. These algorithms could automatically detect similarities and differences between new materials, guiding potential applications and uses. A trio of music, science, and art |
| In 2012, Schedel was in search of a sculptural display for an exhibit on data art at SBU’s Simons Center for Geometry and Physics. A colleague recommended that she talk to Melissa Clarke, an artist who makes data-based multimedia installations using visualizations, sound, and interactive art. At the time, Clarke had just returned from an expedition in the Arctic, where she collected data, images, video, and interviews for an immersive multimedia installation. |
| “Melissa’s work is not only aesthetically beautiful but also based on actual data,” said Schedel. Clarke’s dive into scientific data visualization began in 2009, when she stumbled upon acoustic images that geophysicists had created to map the topography of the bottom of the Hudson River. She ended up turning these images into a video installation on an old ship. |
| “I began my career primarily in video and sound, but data visualization was a natural progression as I sought to provide a narrative and more meaning for my work,” explained Clarke. “The seismic images of the sub-bottom profiles were stunning, and I was fascinated by the process of sending sound down to the river floor and using the sounds that bounce back to create a drawing of the landscape. I come from upstate New York, the landscape of which was created by glaciers. It hit me that data visualization is something I needed to pursue seriously in my work.” |
| Soon after being introduced, Clarke and Schedel co-founded arts.codes, a collective focusing on different art forms with computational underpinnings. And through Schedel, Clarke met Yager and learned of the x-ray scattering data sonification project. Their discussions led to the idea of creating a virtual reality (VR) experience that combined sonification and 3-D installations based on experimental nanoscience data. |
| “Kevin started showing me nanostructure visualizations, and I thought they were so beautiful that I was inspired to draw them,” said Clarke. “I really got interested in how variable the structures looked. During tours of the CFN and NSLS-II, I learned about the equipment that Kevin and other scientists use to take nanoscale 3-D photographs capturing the interaction of a beam of electrons or x-rays with a material. I was very much intrigued.” |
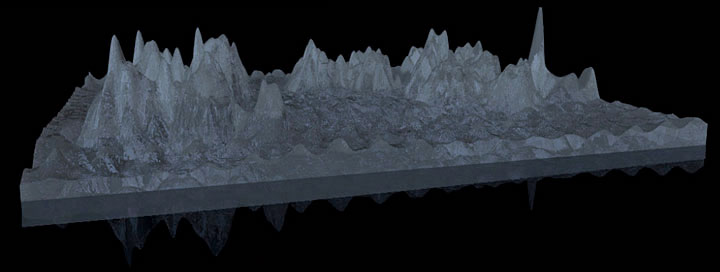 |
| Scientists can generate 3-D height maps of the features on a sample surface at atomic resolution through scanning probe microscopy. An ultrasharp mechanical probe (tip) is brought very close to the surface of interest, and the local interaction of this tip with the surface is measured as the tip is scanned back and forth. (click on image to enlarge) |
Virtual explorations |
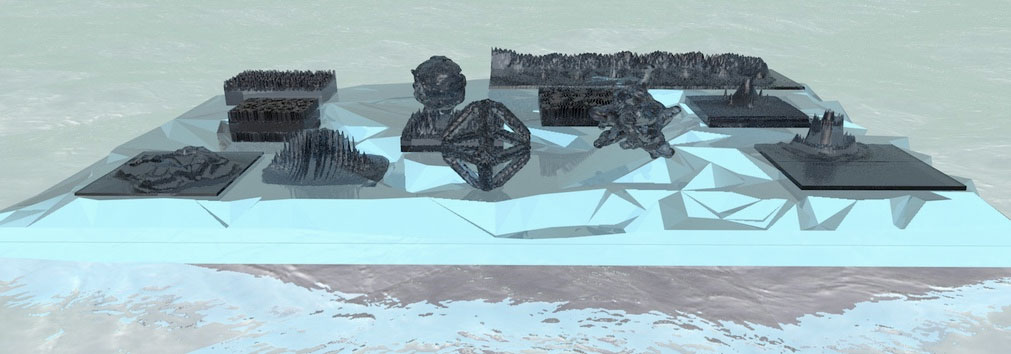
| Clarke turned her drawings into hand-sized 3-D-printed sculptures made of a resin material resembling glass. The resulting collection, accordingly called “Glass Menagerie,” is based on a variety of nanostructure visualizations by CFN scientists, including DNA octahedra created by group leader Oleg Gang, a nanostar (spiky nanoparticle) measured by Huolin Xin, an atomic surface map generated by Percy Zahl, and an x-ray scattering pattern produced by Fang Lu. |
| Glass Menagerie incorporates a VR component that enables headset-wearing viewers to walk up to and into the sculptures as they hear sonifications. |
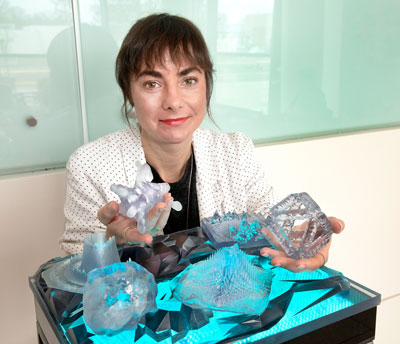 |
| Melissa Clarke holds a nanostar (left) and DNA octahedron (right) sculpture that she 3-D printed based on data collected through electron tomography with a transmission electron microscope. In electron tomography, a beam of electrons is passed through a sample at different angles to generate 3-D structural information. |
| “I generated 10,000 different samples of sonifications from the nanostructure measurements and picked aesthetic ones for the VR experience,” explained Schedel. “So, when you’re looking at a particular structure, you’re not hearing sonifications of that structure in this case. Instead, the sounds correspond to actions. For example, if you point somewhere and teleport to that spot, you hear a Star Trek-like teleporter sound. You’re immersed in this sound world, or soundscape. When you move an object, you get sonic feedback that corresponds to your motion.” |
| Glass Menagerie was first displayed at the U.S. Library of Congress for an event in November 2018. Its unveiling at Brookhaven occurred during the CFN 10-year anniversary event in December 2018. It has since been on display at various venues, including the Knockdown Center for the arts and performances, the Pioneer Works cultural center for the arts and sciences, and Creative Technology Week. |
| The trio is currently working on a more portable “traveling” edition of the installation that uses the freestanding Oculus Go VR headset, which does not require a computer connection. They are also in the process of creating a second “procedural” VR piece that is more interactive. |
| “It is procedural in the sense that every time you interact with it, data are being processed in the VR software program in real time,” explained Clarke. “The initial piece that we made was based on images that Kevin had already created; the second piece will use numerical scientific data. What’s exciting about the procedural piece is that scientists will be able to put their data into VR themselves. That’s the end goal—for them to make their own sculptures and VR pieces for personal use and demonstrations. It isn’t just art for art’s sake.” |
 |
| The second VR piece has a new look and improved user experience that gives users more control over what parts of the data they see and interact with. Users can pick up the sculptures and rotate them to see the view from different angles. (click on image to enlarge) |
| “Many scientists like art or play music, but when they think about their work, they may not see things that an artist would,” added Clarke. “Artists can introduce scientists to different ways of looking at their data and in doing so ignite new ideas. Art also brings in an emotive component, which can help relay numerical concepts. Though my pieces are driven by scientific data, people often react with emotion when they see them. In this way, they are a kind of storytelling medium that can bring people into the conversation about science.” |
| Source: Brookhaven National Laboratory |
|
Subscribe to a free copy of one of our daily Nanowerk Newsletter Email Digests with a compilation of all of the day's news. |

