| Feb 28, 2013 |
A new look at urbanization's environmental impact
|
|
(Nanowerk News) A research team from KTH Royal Institute of Technology has developed a technique for quick, simple and cost-effective mapping of worldwide urban growth and its environmental impact.
|
|
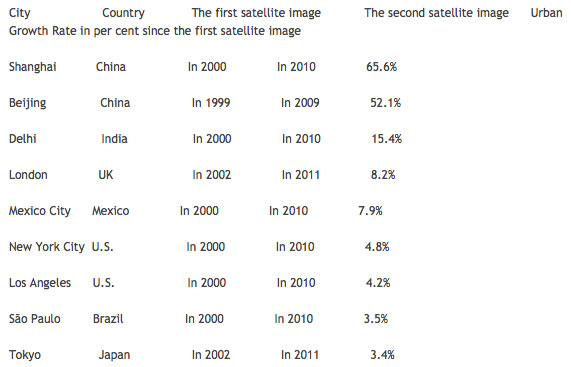
Over the decade between 2000 and 2010, the population of New York City grew 4.8 percent while Shanghai’s increased by 65.6 percent. By 2030, the world’s urban population will increase by another 2 billion. The extent and impact of such rapid urbanization have received relatively little scientific study, particularly in China, where the percentage of the population living in cities rose from 20 to 50 percent during the last 20 years.
|
|
But a new technique to gather information has been developed by Yifang Ban, professor of Geoinformatics at KTH, and her colleagues at Tsinghual University/UC Berkeley, University of Pavia, the German Aerospace Center and Nanjing University. The team combines satellite images from the present and past to create new pictures that reveal the difference a decade or more of growth makes in an urban region.
|
|
The method incorporates synthetic aperture radar (SAR), a technology that is completely impervious to bad weather and clouds, time of day, smog, dust storms and other factors that can interfere with information gathering.
|
|
From these images, they can calculate the impact on the environment.
|
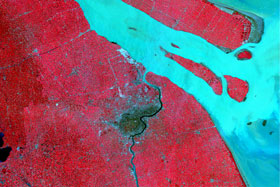 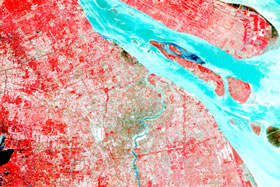 |
| Left: Shanghai in 1979. Right: Shanghai in 2010.
|
|
“We use, among other things, a measure called "loss of ecosystem services value translated into cash" when forest and cultivated land is built on. That loss can be used as a measure of the impact on the environment,” Ban says.
|
|
Examples of ecosystem services include pollinating insects, water purification through wetlands or mussels, natural pesticides and fertile soil.
|
|
The team also identified an environmental problem they call "urban heat islands,” or areas in the city that are significantly warmer than their surrounding rural areas. “The average temperature of the air in a city with 1 million inhabitants is 1 to 3 degrees warmer than outside the city. In the afternoon, the difference can be as much as 12 degrees warmer,” Ban says.
|
|
The impact of heat islands can be found in increased energy consumption for air conditioning, increased emissions and air pollution, heat-related illnesses and deaths, and water quality, she says.
|
|
Ban says that while urbanization can be monitored in different ways, the technique her team developed is “the most cost-effective, the quickest, and the most reliable.” And while China has been the project’s primary focus, the technology will benefit the study of urbanization around the world, particularly in Asia, Africa and South America, where growth has been greatest.
|
|
“Right now we are working with 10 big cities, so-called megacities with a population of around 10 million or more,” Ban says. These are London, New York, Los Angeles, Mexico City, Sao Paulo, Beijing, Shanghai, Tokyo, Moscow and Delhi.
|
|
Here are the preliminary growth figures ("Urban Growth Rate" stands for "Rate of increase of urban area") for some of the world's major cities:
|
 |
|
The Satellite Monitoring of Urbanization in China for Sustainable Development at ESA/MOST's Dragon 2 program was conducted between 2008 and 2012. Research has now expanded into a new research project called Urbanization and Climate in Dragon 3 program, for the years 2012 to 2016.
|

