| May 16, 2023 |
Temperature of solar flares helps understand nature of solar plasma
|
|
(Nanowerk News) The Sun’s rotation produces changes in its magnetic field, which flips completely every 11 years or so, triggering a phase of intense activity. Solar flares – huge eruptions from the surface of the Sun lasting minutes or hours – emit intense bursts of particles and high levels of electromagnetic radiation. The release of energy during solar flares heats the chromosphere, causing almost full ionization of the atomic hydrogen present in the region.
|
|
The chromosphere is a thin layer of plasma that lies at least 2,000 km above the Sun’s visible surface (the photosphere) and below the corona (the Sun's upper atmosphere). The plasma is very dense, and the hydrogen recombines at a very high rate, resulting in a recurring process of ionization and hydrogen recombination that produces a characteristic type of radiation emission in the ultraviolet band known as the Lyman Continuum (LyC) in memory of American physicist Theodore Lyman IV (1874-1954).
|
|
Theoretical descriptions suggest the LyC’s “color temperature” could be associated with the temperature of the plasma that produces the flare, and color temperature could therefore be used to determine plasma temperature during solar storms.
|
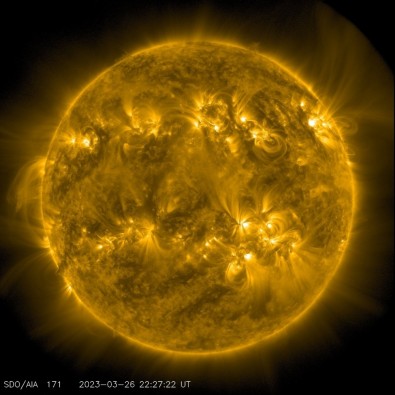 |
| A new study simulated dozens of solar flares and showed that analysis of the Lyman Continuum spectrum formed by hydrogen ionization and recombination can be used for diagnosis of the solar plasma (ultraviolet image of the Sun at a wavelength of 17.1 nanometers, highlighting a spectral line emitted by ironized iron atoms; (Image: Solar Dynamics Observatory/NASA)
|
|
A new study has simulated emissions from dozens of different solar flares and confirmed the link between the LyC’s color temperature and the plasma temperature in the region from which the flare erupts. It also confirms that a local thermodynamic equilibrium occurs in the region between the plasma and the photons in the LyC.
|
|
An article on the study is published in The Astrophysical Journal ("Formation of the Lyman Continuum during Solar Flares").
|
|
The penultimate author of the article is Paulo José de Aguiar Simões, a professor at Mackenzie Presbyterian University’s School of Engineering (EE-UPM) in São Paulo state, Brazil. “We show that the LyC’s intensity increases significantly during solar flares and that analysis of the Lyman spectrum really can be used for diagnosis of the plasma,” said Simões, who is also a researcher at the Mackenzie Radio Astronomy and Astrophysics Center (CRAAM).
|
|
The simulations corroborated an important result obtained at the Solar Dynamics Laboratory by Argentinian astronomer Marcos Machado showing that the color temperature, which in quiet periods is in the region of 9,000 Kelvin (K), rises to 12,000-16,000 K during flares. The article in which he reported this result and of which Simões was also a co-author, was the last published by Machado. A world-renowned expert on the Sun, he died in 2018 while the article was being peer-reviewed.
|
Solar dynamics
|
|
Here it is worth recalling a little of what is known about the Sun’s structure and dynamics. The huge amount of energy that provides Earth with light and heat is mainly generated by conversion of hydrogen into helium in a process of nuclear fusion that takes place deep inside the star. This vast region is not directly observable because light does not cross the Sun’s “surface", which is actually the photosphere.
|
|
“We can observe the region above the surface directly. The first layer, which extends up to an altitude of about 500 km, is the photosphere, with a temperature of around 5,800 K. This is where we see sunspots, in places where the magnetic fields that emerge from the Sun inhibit convection and keep the plasma relatively cool, producing these darker areas we call sunspots,” Simões explained.
|
|
Above the photosphere, the chromosphere extends for some 2,000 km. “The temperature of this layer is higher, exceeding 10,000 K, and the plasma is less dense. Owing to these characteristics, the atomic hydrogen is partially ionized, keeping protons and electrons separate,” he said.
|
|
In a thin transition layer at the top of the chromosphere, the temperature rises sharply to above 1 million K, and plasma density falls by many orders of magnitude. This sudden heating in the passage from chromosphere to corona is a counter-intuitive phenomenon; it would be reasonable to expect the temperature to fall as the distance from the source increases.
|
|
“We don’t have an explanation yet. Various proposals have been presented by solar physicists, but none has been accepted without reservations by the community,” Simões said.
|
|
The corona extends toward the interplanetary medium, without a clear-cut transition region. The Sun’s magnetic fields exert a strong influence on the corona, structuring the plasma, especially in active regions easily identified in ultraviolet images.
|
|
“In these solar storms, the energy accumulated in the coronal magnetic fields is abruptly released, heating the plasma and accelerating the particles. Electrons, which have less mass, can be accelerated to as much as 30% of the speed of light. Some of these particles, which travel along magnetic lines of force, are ejected into the interplanetary medium. Others go in the opposite direction, from corona to chromosphere, where they collide with the high-density plasma and transfer their energy to the medium. This surplus energy heats the local plasma, causing ionization of the atoms. The dynamics of ionization and recombination gives rise to the Lyman Continuum,” Simoes said.
|
|
The spikes in solar activity occur roughly every 11 years. During periods of intense activity, the effects on the Earth are substantial, including more aurora borealis displays, radio communications blackouts, heightened effects of scintillation on GPS signals, and an increase in the drag on satellites, reducing their velocity and hence the altitude of their orbits. These phenomena and the physical properties of the near-Earth interplanetary medium are known as space weather.
|
|
“Besides the fundamental knowledge they provide, studies of the physics of solar flares also improve our ability to forecast space weather. These studies walk on two legs: direct observation, and simulations based on computational models. Observational data in the different bands of the electromagnetic spectrum enables us to understand better the evolution of solar flares and the physical properties of the plasma involved in these events. Computational models, such as those used in our study, serve to test hypotheses and verify interpretations of the observations since they give us access to quantities that can’t be directly obtained from analysis of observational data,” Simões said.
|

