
How Data Storytelling Helps Organizations Make Better Decisions
Key Takeaways About Data Storytelling
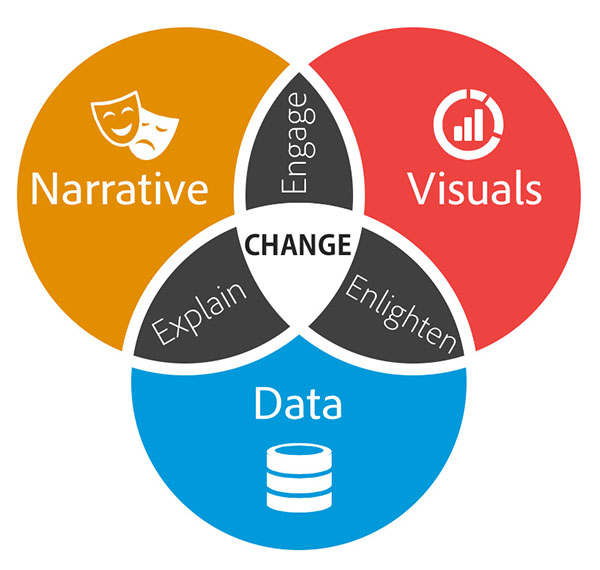
- Definition: Data storytelling combines data, visuals, and narrative to convey insights clearly and persuasively
- Purpose: It helps organizations make informed decisions by translating complex analytics into understandable messages
- Components: A compelling data story includes trustworthy data, well-designed visuals, and context-driven narrative
- Audience Focus: Stories must be tailored to the needs and expectations of decision-makers, not just analysts
- Tools: Common tools include data visualization platforms, business intelligence dashboards, and design software
- Impact: Effective data storytelling increases engagement, drives clarity, and improves the likelihood of action on insights
Data is everywhere today. From the apps we use to browse social media to the online shopping purchases we make, our digital footsteps create massive amounts of data. Companies large and small accumulate vast troves of data on customer interactions, sales metrics, website traffic, manufacturing processes, and more.
Hidden within all of this data are valuable insights about customers, operations, risks, and opportunities. But making sense of endless rows and columns of numbers in spreadsheets can seem daunting for many business professionals and managers. This is where the art of data storytelling for business comes in.
What is Data Storytelling?
Data storytelling involves crafting compelling narratives to explain the patterns, trends, and key takeaways uncovered through data analysis. It goes beyond visualizing analytics and numbers to interpret what the data means. Skilled data storytellers combine data-driven insights with engaging, informative stories tailored to a specific audience. They help simplify complex information and make it memorable using vivid language, captivating visuals, and impactful story structures.
Elements of Great Data Stories
How to tell a story with data, you ask? Great data stories often have common elements that connect with audiences on an emotional level and prompt action on the key insights. Here are some hallmarks of effective data storytelling:
- Relatable characters and scenarios – Using descriptive examples, hypothetical characters, and settings helps make data insights more tangible. This builds understanding and empathy.
- Dramatic arcs – Structuring the narrative to have a beginning, middle, and end creates tension and interest like good books and movies. Obstacles, conflicts, and resolutions are story devices that can highlight important trends.
- Memorable data visualization – Charts, graphs, illustrations and other visuals encode numbers and statistics into easily digestible formats that stick in the minds of audiences and reinforce key points. Many useful data visualization tools exist, such as Tableau, Power BI, Excel charts, Infogram and more. For those looking to learn data visualization techniques, helpful online resources include data visualization beginner tutorials from Chartio, data storytelling courses from Norton Norwitz, and data visualization ebooks like Storytelling with Data by Wiley. These resources offer guidance on presenting data narratives in visually appealing ways that optimize comprehension and recall.
- Concise language – Using simple, clear, and vivid language avoids getting bogged down in jargon and technical terms. This keeps audiences engaged.
- Customized messaging – Tailoring vocabulary, concepts, examples and takeaways for the knowledge level and interests of business managers versus data analysts, for instance, facilitates comprehension.
- Clear call to action – Leading the audience toward next steps or specific decisions provides a clear pathway to act on the insights shared through data storytelling.
Data Storytelling in Action
Many real-world data storytelling examples illustrate the power of this technique:
- A health organization uses data stories with interactive maps and graphs to showcase treatment gaps in different cities related to the opioid crisis. This spurs community leaders to allocate more funding for addiction medicine clinics.
- An energy company unveils data narratives each quarter explaining emerging consumption trends, like the impacts of electric vehicle adoption. This helps government leaders craft policies to meet sustainability goals.
- A retail chain unveils a data story at an annual conference tracing the customer journey from initial ad exposure to point-of-sale. This shows merchandising teams where to fine tune marketing strategies.
- A sports team creates a compelling data story for fans showing how player performance correlates with championship wins. These fun stories drive ticket sales and merchandising revenues.
Data storytelling makes digesting volumes of statistics, spreadsheets, and analytical outputs much less daunting. It provides a powerful way for today's data-rich organizations to inform, inspire, and engage internal and external stakeholders. With insightful narratives reinforced by compelling data visuals, numbers leap off the page. And key insights spring to life allowing better, faster decision making.
For any business leader or manager struggling to synthesize complex data points, focusing on crafting compelling data stories can make the numbers more approachable and actionable. Using the elements and best practices of effective data storytelling covered in this article, you’ll be on your way to bringing your organization’s data insights to life through impactful narratives that drive business value.
Benefits of Data Storytelling
When businesses adopt data storytelling as a practice, they realize several significant benefits that transform how they operate and make decisions. First and foremost, data storytelling dramatically improves decision-making across the organization. By presenting data in context with clear narratives, leaders can quickly grasp complex information and make more informed choices with greater confidence, even when facing ambiguous situations.
Beyond immediate decisions, regular exposure to well-crafted data stories helps teams across the organization become more comfortable interpreting and working with data over time. This increased data literacy creates a virtuous cycle where more employees begin asking smarter questions of their data, leading to deeper insights and better business outcomes.
Data storytelling also serves as a powerful alignment tool. When diverse stakeholders share a common understanding of key insights through compelling narratives, it fosters collaboration and helps teams rally around common goals and priorities based on data evidence rather than opinions or assumptions. This alignment becomes particularly valuable during strategic planning cycles or when implementing significant organizational changes.
From a practical communication standpoint, data stories consistently outperform traditional data presentations. Compared to raw spreadsheets or basic charts, data stories keep audiences more attentive and receptive to the information being shared. The engagement factor shouldn't be underestimated—even the most valuable insights provide no benefit if decision-makers tune out before understanding them.
Perhaps most importantly, storytelling ensures organizations actually realize value from their data investments. Companies invest heavily in data collection systems, analytics platforms, and skilled personnel; data storytelling transforms these technical outputs into actionable business insights that justify these investments. The most effective data stories don't just inform—they transform perspectives and drive meaningful action throughout the organization.
Data Visualization Tools and Resources
Today's market offers a rich ecosystem of tools that help business professionals create compelling visualizations without requiring advanced technical skills. Business intelligence platforms like Tableau, Power BI, and Looker have revolutionized the field by providing intuitive drag-and-drop interfaces to create interactive dashboards and visualizations linked directly to company data sources. These platforms excel at handling large datasets and creating reusable visualization templates that can be updated automatically as new data arrives.
For professionals focused on creating standout presentations or reports, specialized tools such as Infogram, Flourish, and Datawrapper help create publication-quality charts that go beyond basic spreadsheet visuals. These platforms often include design elements specifically created to enhance narrative storytelling, such as annotations, progressive reveals, and animation effects that guide the viewer through a logical sequence of insights.
Organizations with limited budgets need not feel excluded from the data storytelling revolution. Free and open-source options like Google Data Studio, Metabase, and even advanced Excel functions can produce impressive visualizations when skillfully applied. These tools may lack some advanced features of paid platforms but often provide more than enough capability for teams getting started with data storytelling.
Beyond the tools themselves, numerous learning resources have emerged to help professionals master the art of data storytelling. Platforms such as DataCamp, Coursera, and LinkedIn Learning offer specialized courses in data visualization and narrative techniques. Community resources like the Data Visualization Society, Information is Beautiful, and Flowing Data showcase inspiring examples that can elevate your own data storytelling practice through exposure to creative approaches from diverse industries.
When selecting visualization tools, the most important consideration isn't necessarily technical sophistication but rather appropriateness for your specific context. Consider your organization's technical capabilities, integration needs with existing systems, and the primary audience for your data stories. Sometimes simple visuals created in familiar tools prove more effective than complex visualizations that require specialized knowledge to maintain.
Getting Started with Data Storytelling
For professionals looking to incorporate data storytelling into their business communications, the journey begins by framing your data exploration around specific business questions that matter to your audience. Rather than starting with whatever data is available, effective storytellers first clarify what decisions need to be made or what actions could result from better understanding. This question-first approach ensures relevance and focuses the subsequent analysis.
Once you've identified your key questions, invest time understanding your audience's existing knowledge, preferences, and decision-making context. Are they technically oriented or more focused on business outcomes? Do they prefer detailed analysis or executive summaries? Will they view your story in a live presentation or read it as a standalone document? These considerations should shape every aspect of your storytelling approach, from vocabulary choices to visualization complexity.
When crafting the actual story, follow classic narrative structures that have engaged human minds for centuries. Set the scene with relevant context, introduce tension through presenting a challenge or opportunity revealed in the data, build toward key insights that might surprise or clarify, and conclude with clear implications or recommended actions. This narrative arc keeps audiences engaged while ensuring they understand both what the data shows and why it matters.
Throughout the process, practice ruthless editing of both content and visuals. The most common mistake in data storytelling is overwhelming audiences with too much information. Each chart, graph, or data point should earn its place by directly contributing to the central narrative. Remove decorative elements that don't add informational value, and consider creating supplementary materials for those who might want to explore additional details after grasping the main story.
Finally, seek feedback and iterate on your approach. Data storytelling is both an art and a science that improves with practice and constructive criticism. Pay attention to which aspects of your stories generate the most engagement or lead to clearest decisions, and continuously refine your technique based on these observations. With persistence and attention to these principles, any business professional can transform raw data into compelling narratives that drive better business outcomes.
Frequently Asked Questions
What exactly is data storytelling and how does it differ from regular data analysis?
Data storytelling is the practice of combining data, narrative, and visuals to communicate insights in a compelling way. While traditional data analysis focuses on extracting findings from datasets, data storytelling goes further by contextualizing those findings within a narrative framework that explains their significance and guides audiences toward understanding and action. Effective data storytelling transforms raw numbers into meaningful insights that resonate with audiences on both intellectual and emotional levels.
Do I need technical expertise to create effective data stories?
While technical skills can be helpful, effective data storytelling is primarily about communication rather than technical expertise. Business professionals with strong communication skills can create powerful data stories even with basic tools like Excel or PowerPoint. More important than technical prowess is the ability to identify meaningful patterns in data, understand your audience's needs, and craft a narrative that connects insights to business outcomes. That said, familiarity with visualization tools can certainly enhance your storytelling capabilities.
How do I choose the right type of visualization for my data story?
The right visualization depends on the specific insight you want to communicate. For comparisons between categories, bar charts typically work best. For showing trends over time, line graphs are most effective. To display proportions of a whole, pie or donut charts can work well for a small number of categories. For relationships between variables, scatter plots are ideal. Always prioritize clarity over complexity, and consider your audience's familiarity with different chart types. When in doubt, simpler visualizations that clearly communicate your main point are better than sophisticated visualizations that might confuse your audience.
How can I make my data stories more memorable and impactful?
The most memorable data stories connect analytics to human experiences. Include concrete examples or anecdotes that illustrate the real-world implications of your data. Use analogies that relate complex concepts to familiar situations. Create emotional resonance by highlighting how the insights affect people, whether customers, employees, or communities. Visually, use color strategically to highlight key points, incorporate relevant icons or images, and ensure a clean, uncluttered design. Finally, end with a clear call to action that gives your audience a path forward based on the insights you've shared.
Is data storytelling only relevant for large organizations with data science teams?
Data storytelling is valuable for organizations of all sizes. Small businesses often have advantages in this area because they typically have more direct connections to their customers and operations, creating richer context for their data stories. Even with limited data sources like point-of-sale systems, customer feedback, or website analytics, small businesses can craft meaningful narratives about customer behavior, market trends, or operational efficiency. The key is focusing on quality insights rather than quantity of data, and connecting those insights to specific business questions that matter to your organization.
How can I avoid misleading my audience when telling stories with data?
Ethical data storytelling begins with honest analysis. Avoid cherry-picking data points that support a predetermined narrative while ignoring contradictory evidence. Present appropriate context, including sample sizes, time periods, and methodological limitations. Choose visualization formats that accurately represent the scale and relationships in your data (for example, always start bar chart axes at zero). When sharing uncertain or preliminary findings, clearly communicate the limitations. Remember that your goal should be to illuminate truth rather than persuade at all costs. Building a reputation for honest, transparent data storytelling ultimately creates more value than selective presentation of facts.
What's the ideal length or complexity for a data story in a business context?
The ideal length depends on your audience, purpose, and delivery format. For executive presentations, focus on a concise narrative (3-5 minutes) with 2-3 key visualizations highlighting the most important insights. For detailed analysis shared with technical teams, longer formats with multiple visualizations may be appropriate. For board meetings, aim for a 10-15 minute presentation with clear executive summaries. Regardless of length, maintain a clear through-line connecting your data to business implications. If sharing written reports, use a pyramid structure with the most important findings and recommendations upfront, followed by supporting details for those who want to dive deeper.
How can I improve my data storytelling skills as a business professional?
Developing strong data storytelling skills takes practice and intentional learning. Start by studying examples of effective data stories from sources like the New York Times, Financial Times, or organizations in your industry. Take courses in data visualization and narrative techniques through platforms like Coursera, DataCamp, or LinkedIn Learning. Practice creating stories with public datasets before working with sensitive business data. Seek feedback from colleagues with different perspectives and expertise levels. Join communities like the Data Visualization Society to connect with other practitioners. Most importantly, incorporate storytelling techniques into your regular business communications and refine your approach based on audience engagement and decision outcomes.

Check out our SmartWorlder section to read more about smart technologies.
