Spatial Genomics: Definition, Methods, Applications, and Limitations
What Is Spatial Genomics?
Spatial genomics is a set of methods for measuring gene activity, DNA-associated features, proteins or other molecular signals while preserving where those signals occur in tissue. In practice, the term is often used for spatially resolved tissue profiling, especially spatial transcriptomics, but it can also refer to the three-dimensional organization of DNA inside the nucleus.
Spatial genomics adds location to molecular biology. Bulk sequencing measures an average signal from many cells, while standard single-cell sequencing usually requires tissue to be dissociated into a suspension. Both approaches can identify genes and cell types, but they lose much of the tissue architecture that explains biological function. Spatial genomics keeps the molecular readout connected to physical position, allowing researchers to ask where a gene is active, which cells are nearby, and how molecular states relate to blood vessels, immune infiltrates, tumour borders, tissue layers or damaged regions. This makes it an important branch of modern biotechnology.
A useful way to read the term is this: spatial transcriptomics maps RNA in tissue, spatial proteomics maps proteins, spatial metabolomics maps metabolites, and spatial omics is the broader umbrella for all of these. Spatial genomics is sometimes used as that umbrella, especially in biotechnology and pathology, although strictly speaking many current experiments measure transcripts rather than DNA sequence itself. This article focuses on tissue-level spatial genomics and spatial transcriptomics, then separately explains the older genome-biology meaning: DNA folding in three-dimensional nuclear space.
Not to be confused with: ordinary single-cell RNA sequencing, which profiles dissociated cells without their original positions; classical histology, which preserves tissue structure but usually measures fewer molecular features; or 3D genome organization, which maps how chromosomes fold inside the nucleus rather than how cells are arranged across a tissue section.
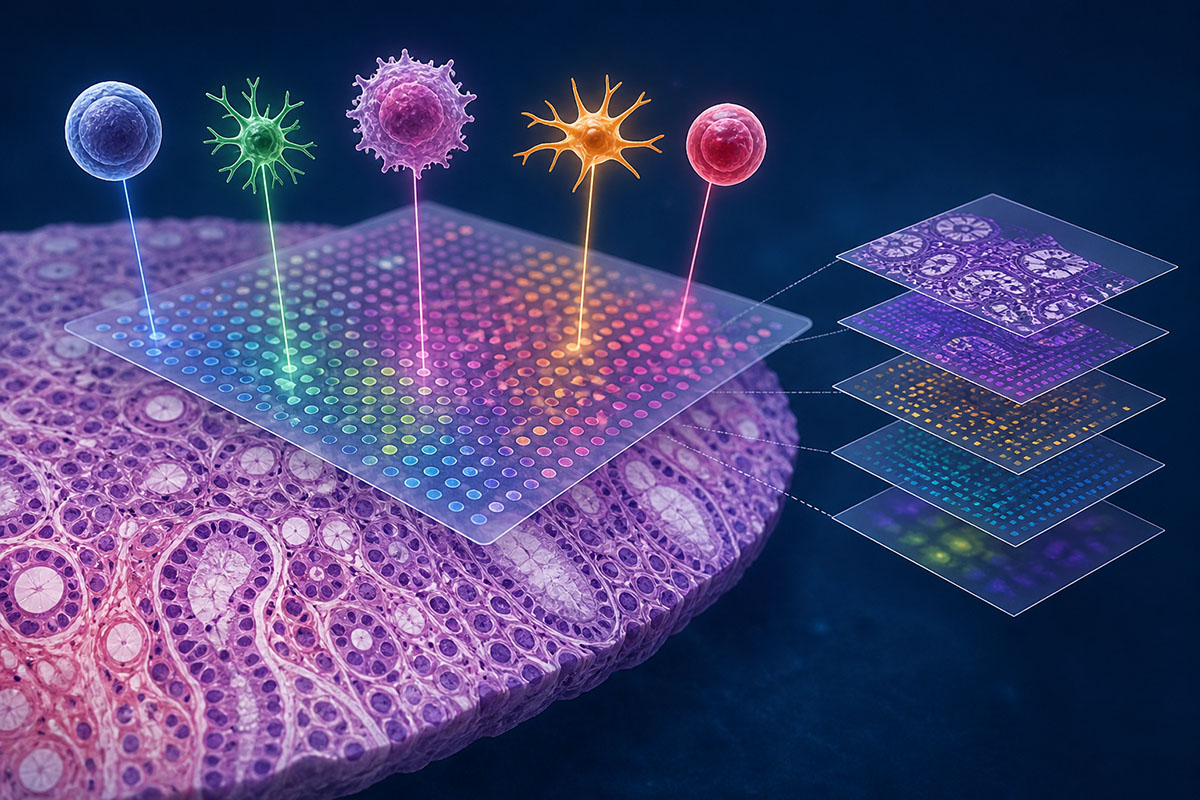
Spatial genomics links molecular readouts to physical position, allowing gene expression, proteins or other features to be interpreted in the context of tissue architecture. (Image: Nanowerk) (click on image to enlarge)
Spatial Genomics, Spatial Transcriptomics, and Spatial Omics
| Term | What it usually measures | Typical question | Important caveat |
|---|---|---|---|
| Spatial transcriptomics | RNA molecules or gene-expression profiles in tissue | Which cell states or gene programs appear in each tissue region? | It may be whole-transcriptome or targeted, depending on the platform. |
| Spatial genomics | Often used for spatial gene-expression and genome-associated tissue profiling; in another context, DNA folding in the nucleus | Where are molecular states, variants, chromatin states or regulatory features located? | The term is broader and less precise than spatial transcriptomics. |
| Spatial proteomics | Proteins, post-translational modifications or immune markers | Which protein-defined cell types and signalling states occupy each tissue niche? | Antibody quality and marker selection strongly affect interpretation. |
| Spatial metabolomics | Small molecules, lipids, metabolites or drugs | Where are metabolic states or drug distributions located? | Molecular identification and multi-omic alignment can be difficult. |
| Spatial omics | Any molecular layer measured with location retained | How do molecular layers combine to form a tissue ecosystem? | It is the broadest and often the most accurate umbrella term. |
Why Spatial Context Matters
Tissues are not random mixtures of cells. A tumour contains malignant clones, immune cells, fibroblasts, blood vessels, necrotic areas and invasive edges. A brain region contains layered neuronal populations, glial cells and local circuits. A developing organ contains gradients, boundaries and signalling centres. In all of these examples, cell identity alone is incomplete: the meaning of a cell state depends on where it appears and what surrounds it.
Spatial genomics turns this context into data. A T cell touching a tumour cell may imply a different immune state from the same T cell trapped in surrounding stroma. A fibroblast at a wound edge may express a different program from a fibroblast in healthy tissue. A neuronal subtype may be defined partly by the layer or nucleus in which it sits. By preserving coordinates, spatial methods let researchers quantify these relationships instead of describing them only by microscopy.
How Spatial Genomics Works
Most tissue-level workflows begin with a thin tissue section on a slide. The section is stained and imaged, then processed so RNA, proteins or other molecules can be measured while their coordinates are retained. The main platform families differ in how they attach a location to each molecule.
1. Sequencing-based capture
Sequencing-based methods use a slide or bead array patterned with DNA capture probes. Each probe carries a spatial barcode that identifies its location, a unique molecular identifier that helps count original molecules, and a capture sequence that binds RNA from the tissue. After permeabilisation, RNA is captured, converted to cDNA and analysed by next-generation sequencing.
The main advantage is broad gene coverage, often across the whole transcriptome. The main limitation is resolution. A capture spot or bin may contain part of a cell, one cell or several cells depending on feature size, tissue density and chemistry. Classic spot-based methods often require deconvolution to estimate which cell types contributed to a mixed signal. Higher-resolution arrays reduce this problem but still require careful segmentation, sensitivity checks and binning.
2. Imaging-based in situ detection
Imaging-based methods detect molecules directly in tissue. Techniques such as MERFISH and seqFISH, and commercial systems such as MERSCOPE, Xenium and CosMx, use repeated rounds of hybridisation, ligation, imaging or probe readout to decode RNA molecules in place. Because transcripts are imaged where they sit, these methods can support single-cell maps and sometimes subcellular localization.
The main advantage is high spatial precision. The main trade-off is target selection. Most imaging-based assays measure a designed gene panel rather than every transcript. Panels can now include hundreds to several thousand genes, and newer high-plex assays such as Xenium 5K are designed for broader single-cell spatial discovery, but panel design remains a scientific decision. A good panel can identify cell types and pathways with high confidence; a poor panel can miss unexpected biology.
3. Region-of-interest profiling
Region-of-interest methods, such as GeoMx Digital Spatial Profiler, allow a researcher or pathologist to select compartments on a stained section and then release or count barcoded probes from those areas. These methods do not usually create a continuous single-cell map, but they can profile large gene or protein panels from histologically meaningful regions such as tumour nests, immune aggregates, glands or lesion borders.
4. Spatial multi-omics
Spatial genomics increasingly overlaps with other molecular layers. Spatial epigenetics can map chromatin accessibility or histone marks. Spatial proteomics measures protein abundance or immune markers. Spatial metabolomics, often using mass-spectrometry imaging, maps small molecules, lipids and drug distributions. Multi-omic studies may measure several layers in the same section or align serial sections computationally.
Resolution: The Most Common Source of Misunderstanding
Spatial resolution is not a single property. A method may have small capture features but low molecular sensitivity, or it may detect individual molecules but only for a targeted gene panel. For this reason, claims about "single-cell resolution" should be read carefully.
| Resolution level | What it means | Typical interpretation risk |
|---|---|---|
| Multicellular spot | Each measurement combines several nearby cells | Cell-type mixtures must be inferred, not directly observed. |
| Near-cellular or binned | Capture areas are close to cell scale but do not always match cell boundaries | Small bins can be mistaken for actual cells. |
| Single-cell | Molecules or signals are assigned to segmented cells | Segmentation errors can create false cell states or false interactions. |
| Subcellular | Individual molecules can be localized within parts of cells | Biological interpretation still depends on molecule counts, staining quality and cell boundaries. |
A reliable spatial study states the measurement unit clearly: spot, bin, cell, nucleus, region of interest or molecule. It also reports how tissue images were registered, how cells were segmented, how low-quality areas were removed and how key spatial claims were validated.
Major Platform Families and Trade-offs
No spatial genomics platform is best for every question. A discovery atlas may favour whole-transcriptome capture. A pathology-adjacent study using archived formalin-fixed paraffin-embedded (FFPE) samples may favour targeted imaging. A drug-distribution project may require spatial metabolomics rather than RNA. The correct platform is the one whose limitations are acceptable for the biological question.
| Platform family | Representative methods | Main strength | Main limitation | Best fit |
|---|---|---|---|---|
| Spot or array capture | Visium, Visium HD, Slide-seq, Stereo-seq, DBiT-seq | Broad gene coverage and sequencing-based discovery | Mixed-cell signals, sensitivity limits and binning choices | Atlases, discovery studies and broad comparison of tissue regions |
| Imaging-based transcriptomics | MERFISH, seqFISH, MERSCOPE, Xenium, CosMx | High spatial precision and molecule-level localization for selected genes | Targeted panels and strong dependence on segmentation and imaging quality | Cell-neighbourhood analysis, FFPE studies and tumour microenvironment mapping |
| Region-of-interest profiling | GeoMx and related ROI methods | Works well with pathology-defined compartments and clinical samples | Not usually a continuous single-cell map | Studies centred on known histological regions or tissue microarrays |
| Spatial proteomics | Imaging mass cytometry, multiplexed ion beam imaging, CODEX/PhenoCycler, multiplexed immunofluorescence | Direct protein and immune-phenotype measurement | Marker number, antibody validation and batch effects | Immunology, pathology and cell-state validation |
| Spatial metabolomics or epigenomics | Mass-spectrometry imaging, spatial ATAC-like and CUT&Tag-like assays | Adds biochemical or regulatory information beyond RNA | Lower maturity and harder integration than RNA-based workflows | Drug distribution, metabolism and gene-regulatory mechanisms |
Typical Experimental Workflow
- Define the biological question. Decide whether the study needs whole-tissue architecture, cell neighbourhoods, subcellular RNA localization, pathology-defined regions or 3D genome contacts.
- Choose the sample type. Fresh-frozen tissue can preserve RNA well for many discovery workflows. FFPE tissue is critical for clinical archives but requires compatible chemistry and quality control.
- Select the platform. Match gene coverage, resolution, tissue area, sample number, preservation method, cost and analysis capacity.
- Plan controls. Include biological replicates, tissue-quality checks, staining controls, orientation records and orthogonal validation where possible.
- Generate data. Section, stain, image, capture or probe molecules, sequence or image the readout, and align measurements to tissue morphology.
- Analyse and validate. Perform image registration, cell segmentation or spot definition, quality control, normalization, cell-type annotation, spatial-domain detection, neighbourhood analysis and validation of the main findings.
Computational Analysis
Bioinformatics for spatial genomics must handle both molecular data and geometry. Common steps include image registration, tissue and cell segmentation, spot deconvolution, normalization, cell-type annotation, spatially variable gene detection, spatial-domain discovery, neighbourhood enrichment, ligand-receptor inference and comparison across donors, regions or treatments.
Single-cell sequencing often acts as a reference. Dissociated single-cell RNA-seq provides detailed cell-type profiles, while spatial data reveal where those cell types are located. In array-based data, reference atlases help estimate which cell types contribute to mixed spots. In imaging-based data, single-cell references help choose gene panels and assign cell states. The two approaches are therefore complementary rather than competing.
Artificial intelligence is becoming increasingly important because spatial datasets resemble both molecular matrices and images. Graph neural networks can model cells as nodes connected by neighbourhoods, while image-to-omics tools attempt to infer molecular patterns from histology. These methods are promising, but they can also amplify artefacts if staining, segmentation, batch correction or training data are weak. Spatial biology still needs interpretable statistics and experimental validation.
The Other Meaning: 3D Genome Organization
In genome biology, spatial genomics can mean the physical folding of chromosomes inside the nucleus. DNA is not arranged randomly. Chromosomes occupy territories; enhancers loop to promoters; topologically associating domains help organize regulatory contacts; and long-range chromatin structure influences gene regulation.
Methods such as Hi-C, Micro-C, single-cell Hi-C and imaging-based DNA tracing measure which genomic loci are close to one another. These experiments answer different questions from tissue-level spatial transcriptomics. A tissue-level experiment might ask where macrophages sit within a tumour. A 3D-genome experiment might ask whether an enhancer contacts an oncogene promoter inside the nucleus.
Applications in Research and Medicine
Cancer and the tumour microenvironment
Cancer is a major use case because tumour behaviour depends on spatial organization. Spatial genomics can identify immune-excluded tumours, invasive fronts, hypoxic regions, stromal barriers, tertiary lymphoid structures and drug-resistant niches. These maps support immunotherapy research by showing not only which immune cells are present but whether they reach malignant cells and what functional state they occupy.
Neuroscience, development and organ atlases
The nervous system is spatial by design, with cell types arranged in layers, nuclei and circuits. Spatial transcriptomics helps connect neuronal and glial states to anatomy. In development and regeneration, spatial data reveal gradients, boundaries and cell-cell interactions that guide tissue formation. Large atlas projects use these methods to build reference maps of healthy, developing and diseased organs.
Drug discovery and precision medicine
Spatial readouts are useful in biomarker discovery, mechanism-of-action studies and translational pathology. A drug may affect a pathway only in a specific cell type or region, and this local effect can be invisible in bulk data. Spatial genomics can complement tumour DNA sequencing by showing how mutations, cell states and microenvironments are arranged in tissue, an important step toward more tissue-aware personalized medicine.
However, spatial genomics is not yet a routine clinical diagnostic tool for most indications. It is most widely used in research, translational studies, biomarker discovery and specialized pathology-adjacent projects. Wider clinical use will require validated assays, reproducible segmentation, standardized metrics, clear reporting and regulatory-quality interpretation.
Limitations and Common Pitfalls
- Overclaiming single-cell resolution. Small capture features or dense transcript maps do not automatically prove accurate single-cell biology.
- Ignoring tissue quality. RNA degradation, fixation artefacts, section thickness, folds, tears, autofluorescence and uneven staining can dominate the result.
- Confusing proximity with interaction. Nearby cells may interact, but spatial closeness alone does not prove signalling or causality.
- Panel bias. Targeted imaging assays detect only selected genes, so panel design should be justified and documented.
- Batch and section effects. Serial sections are similar but not identical; multi-omic alignment across sections is inference unless the assay truly measures several layers in the same cell.
- Weak statistics. Spatial measurements are autocorrelated. Treating neighbouring cells as fully independent can exaggerate significance.
- Insufficient validation. Important patterns should be checked with orthogonal stains, independent cohorts, perturbation experiments or clinical outcome data when possible.
Future Directions
The field is moving toward larger tissue areas, higher sensitivity, stronger FFPE compatibility, richer multi-omics and more standardized analysis. Three-dimensional spatial profiling will make it possible to reconstruct volumes rather than single sections. Better benchmarking will help researchers compare sensitivity, specificity, segmentation quality and reproducibility across platforms.
The most important shift is conceptual. Spatial genomics turns tissue from a static picture into a measurable molecular ecosystem. Instead of asking only which genes are active, researchers can ask where they are active, which cells are nearby, which tissue structures constrain them and how those relationships change during development, disease or treatment.
Key Terms Related to Spatial Genomics
Spatial barcode: A DNA sequence that identifies the physical location where an RNA molecule or other target was captured.
UMI: A unique molecular identifier used to distinguish original molecules from PCR duplicates.
Cell segmentation: The computational process of assigning detected molecules or pixels to individual cells.
Spot deconvolution: The estimation of which cell types contributed to a mixed capture spot.
Spatial domain: A tissue region with a coherent molecular, cellular or histological identity.
Ligand-receptor inference: A computational analysis that looks for plausible signalling relationships between neighbouring cell types based on expression of ligand and receptor genes.
FFPE: Formalin-fixed paraffin-embedded tissue, the standard preservation format for many pathology archives.
Frequently Asked Questions
Is spatial genomics the same as spatial transcriptomics? Not exactly. Spatial transcriptomics maps RNA in tissue and is the most widely used part of the field. Spatial genomics is broader and may include genome-associated features, proteins, metabolites or 3D genome organization, depending on context.
How is spatial genomics different from single-cell sequencing? Single-cell sequencing usually profiles dissociated cells and loses native position. Spatial genomics keeps molecular measurements tied to tissue coordinates, allowing cell identity to be linked to neighbours, structures and disease regions.
Can spatial genomics be used on archived clinical samples? Yes, but platform choice matters. Many targeted imaging and region-of-interest methods work with FFPE tissue, while some discovery workflows perform best on fresh-frozen samples. RNA quality, fixation and staining strongly affect results.
Is spatial genomics single-cell resolution? Sometimes. Imaging-based approaches can support single-cell or subcellular maps, while array-based methods range from multicellular spots to near-cellular bins. The real unit of analysis must be stated clearly.
What is the main limitation of spatial genomics? The main limitation is the trade-off among gene coverage, sensitivity, tissue area, cost, sample compatibility and resolution. Interpretation also depends on tissue quality, segmentation, statistics and validation.
Is spatial genomics used in routine clinical diagnostics? For most diseases, not yet. It is mainly used in research, translational studies and biomarker development. Routine clinical use will require validated assays, standardized analysis and regulatory-quality reporting.
Selected References
Science, Visualization and Analysis of Gene Expression in Tissue Sections by Spatial Transcriptomics
Science, Comprehensive Mapping of Long-Range Interactions Reveals Folding Principles of the Human Genome
Nature Reviews Genetics, The Emerging Landscape of Spatial Profiling Technologies
Nature Reviews Molecular Cell Biology, Profiling Cell Identity and Tissue Architecture with Single-Cell and Spatial Transcriptomics
Nature Biotechnology, Standardized Metrics for Assessment and Reproducibility of Imaging-Based Spatial Transcriptomics Technologies
Nature Communications, Systematic Benchmarking of Imaging Spatial Transcriptomics Platforms
Nature Reviews Genetics, Spatial Architecture of Development and Disease
