| Jul 27, 2020 |
Study: Mapping crystal shapes could fast-track 2D materials(Nanowerk News) Materials scientists at Rice University and the University of Pennsylvania are calling for a collective, global effort to fast-track the mass production of 2D materials like graphene and molybdenum disulfide. |
| In a perspective article published in Materials Today ("Towards controlled synthesis of 2D crystals by chemical vapor deposition (CVD)"), journal editor-in-chief Jun Lou and colleagues make a case for a focused, collective effort to address the research challenges that could clear the way for large-scale mass production of 2D materials. |
 |
| An array of crystal shapes of 2D transition metal dichalcogenides as imaged with a scanning electron microscope. (Image: MSNE/Rice University) (click on image to enlarge) |
| Lou and fellow Rice materials scientists Ming Tang, Jing Zhang and Fan Wang joined Penn’s Vivek Shenoy in describing the potential transformation in 2D materials technology that could result from a systematic, communitywide effort to map the shapes of the 2D crystals that are being grown in labs worldwide via a process known as chemical vapor deposition (CVD). |
| “Like snowflakes in nature, 2D crystals exhibit a rich variety of morphologies under different growth conditions,” they wrote. |
| Mapping these unique crystal patterns and compiling the maps in a global database, alongside the recipes for creating each pattern, could unlock a wealth of information “for understanding, diagnosing and controlling the CVD process and environment for 2D material growth,” the researchers wrote. |
| CVD is a commonly used process for creating thin films, including commercially important materials in the semiconductor industry. In a typical CVD reaction, a flat sheet of material called a substrate is placed in a reaction chamber and gases are flowed through the chamber in such a way that they react and form a solid film atop the substrate. |
| One goal of the field is developing computer software that can accurately predict the properties of a thin film that will result from the mixing of specific reactant gases under specific conditions. Creating such models is complicated by both an incomplete understanding of the physical and chemical processes that take place during CVD and by the existence of dozens of CVD reactor formats. |
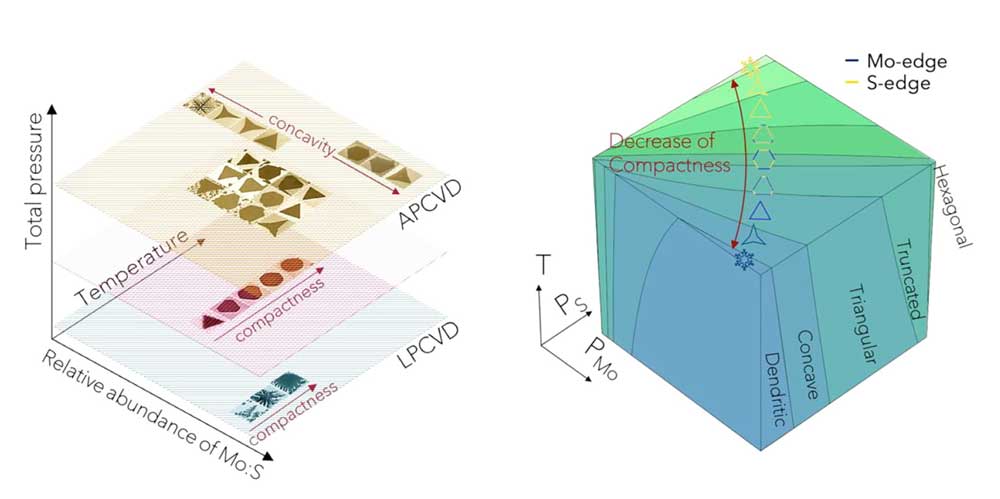 |
| Inspired by the work of Japanese snowflake researcher Ukichiro Nakaya, materials scientists from Rice University the University of Pennsylvania created a Nakaya-like diagram of 2D crystal shapes of molybdenum disulfide produced via chemical vapor deposition (left) and a complete morphology diagram of molybdenum sulfide (right). (Image: MSNE/Rice University) (click on image to enlarge) |
| Cataloging the shape of crystals produced by CVD experiments could provide materials scientists with important information about their synthesis, in much the same way that mineralogists retrieve valuable clues about the history of Earth based on examination of naturally occurring crystal structures, Lou and colleagues suggested. |
| “Take the beautiful snowflakes as an example,” the authors wrote. “A perhaps surprising fact to many is that snow crystals can exhibit many different categories of shapes, which depend on the temperature and water supersaturation of the atmosphere in which they are formed.” |
| The Japanese scientist Ukichiro Nakaya, through extensive observations of snowflakes in both nature and the laboratory, developed a figure known as the Nakaya diagram to help decipher the information in snowflakes. By examining the shapes in a snowflake, and seeing where those shapes lie on Nakaya’s diagram, scientists can determine the exact atmospheric conditions that produced the snowflake, which Nakaya poetically referred to as “a letter from the sky.” |
| Inspired by Nakaya’s work, Lou and colleagues created a Nakaya-like diagram of 2D crystal patterns that have been produced via CVD and demonstrated how it and other morphology diagrams could be used to infer clues about process variables like gas flow rates and heating temperatures that produced each pattern. |
| Thanks to advances in real-time imaging and in automated systems that can produce large datasets of crystal structures, the authors said there is “real potential for morphology diagram development to become a common practice and serve as a cornerstone of crystal growth.” |
| Source: By Jade Boyd, Rice University |
|
Subscribe to a free copy of one of our daily Nanowerk Newsletter Email Digests with a compilation of all of the day's news. |

