| Aug 17, 2022 |
Uncovering nature's patterns at the atomic scale in living color
(Nanowerk News) Machine learning method for harnessing large volumes of X-ray data will speed materials discovery.
|
|
Color coding makes aerial maps much more easily understood. Through color, we can tell at a glance where there is a road, forest, desert, city, river or lake.
|
|
Working with several universities, the U.S. Department of Energy’s (DOE) Argonne National Laboratory has devised a method for creating color coded graphs of large volumes of data from X-ray analysis (PNAS, "Harnessing Interpretable and Unsupervised Machine Learning to Address Big Data from Modern X-ray Diffraction").
|
|
This new tool uses computational data sorting to find clusters related to physical properties, such as an atomic distortion in a crystal structure. It should greatly accelerate future research on structural changes on the atomic scale induced by varying temperature.
|
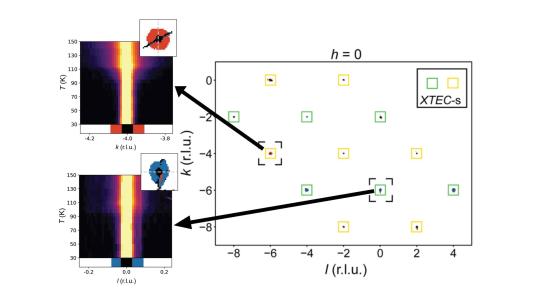 |
| Machine learning provides a color coded map of X-ray data based on the temperature dependence of each region. X-TEC identified the locations of two sets of sharp peaks (yellow and green squares) in the data, as well as diffuse scattering halos around them (red and blue). (Image: Argonne National Laboratory)
|
|
“Our method uses machine learning to rapidly analyze immense amounts of data from X-ray diffraction,” said Raymond Osborn, senior physicist in Argonne’s Materials Science division. “What might have taken us months in the past, now takes about a quarter hour, with much more fine grained results.”
|
|
For over a century, X-ray diffraction, or XRD, has been one of the most fruitful of all scientific methods for analyzing materials. It has provided key information on the 3D atomic structure of innumerable technologically important materials.
|
|
In recent decades, the amount of data being produced in XRD experiments has increased dramatically at large facilities such as the Advanced Photon Source (APS), a DOE Office of Science user facility at Argonne. Sorely lacking, however, are analysis methods that can cope with these immense data sets.
|
|
The team calls their new method X-ray Temperature Clustering, or XTEC for short. It accelerates materials discoveries through rapid clustering and color coding of large X-ray data sets to reveal previously hidden structural changes that occur as temperature increases or decreases. A typical large data set would be 10,000 gigabytes, equivalent to roughly 3 million songs of streaming music.
|
|
XTEC draws on the power of unsupervised machine learning, using methods developed for this project at Cornell University. This machine learning does not depend on initial training and learning with data already well studied. Instead, it learns by finding patterns and clusters in large data sets without such training. These patterns are then represented by color coding.
|
|
“For example, XTEC might assign red to data cluster one, which is associated with a certain property that changes with temperature in a particular way,” Osborn said. “Then, cluster two would be blue, and associated with another property with a different temperature dependence, and so on. The colors tell whether each cluster represents the equivalent of a road, forest or lake in an aerial map.”
|
|
As a test case, XTEC analyzed data from beamline 6-ID-D at the APS, taken from two crystalline materials that are superconducting at temperatures close to absolute zero. At this ultralow temperature, these materials switch to a superconducting state, offering no resistance to electrical current. More important for this study, other unusual features emerge at higher temperatures related to changes in the material structure.
|
|
By applying XTEC, the team extracted an unprecedented amount of information about changes in atomic structure at different temperatures. Those include not only distortions in the orderly arrangement of atoms in the material, but also fluctuations that occur when such changes happen.
|
|
“Because of machine learning, we are able to see materials’ behavior not visible by conventional XRD,” Osborn said. “And our method is applicable to many big data problems in not only superconductors, but also batteries, solar cells, and any temperature-sensitive device.”
|
|
The APS is undergoing a massive upgrade that will increase the brightness of its X-ray beams by up to 500 times. Along with the upgrade will come a significant increase in data collected at the APS, and machine learning techniques will be essential to analyzing that data in a timely manner.
|

