| Mar 16, 2015 |
Groundbreaking research 'measures the pulse of planet Earth' to reveal hidden patterns of climate change
|
|
(Nanowerk News) International research team led by University of Leicester reveals subtle changes in Europe’s climate through method used by heart surgeons.
|
|
Method ‘literally takes the pulse of the planet’ to detect regularity of climate change data
Results show hidden patterns of climate change are often overlooked by other types of analysis
Study provides a map visualisation of the entropy results for the first time, showing the time scales which have changed most
|
|
An international research team led by the University of Leicester has for the first time harnessed technology typically used to diagnose heart disease in order to measure planet Earth’s pulse – and has uncovered hidden patterns of climate change often overlooked by other types of measurement.
|
|
The statistical method is called ‘multi-scale entropy analysis’ and has not been used to study climate data before.
|
 |
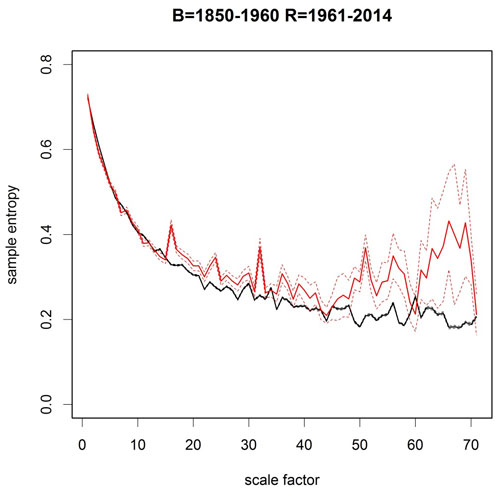
| “Multi-scale sample entropy” of the CRUTEM4v temperature anomaly data over Central Europe. Time-scales at which the data are aggregated are shown as the scale factor (in months). Black=1850 to 1960. Red=1961 to 2014. Bold lines show the mean of all grid boxes and thin lines show the upper and lower bounds of the 95% confidence interval. The data show that the aggregated temperature data with scale factors greater than about 12 months have a markedly higher sample entropy in the recent past (red) than before 1960 (black).
|
|
Multi-scale entropy analysis works by pattern matching and searches data for repetitive small chunks - or pattern templates - that appear over and over again.
|
|
If many of these chunks are found, then the data has low entropy and high regularity. If few are found, the entropy is high and the system is harder to predict.
|
|
Professor Heiko Balzter from the Centre for Landscape and Climate Research and the Department of Geography at the University of Leicester and lead author of the study ("Multi-Scale Entropy Analysis as a Method for Time-Series Analysis of Climate Data") explained: “I had the idea to apply a new method to the climate data. It has been applied a lot to diagnose heart disease, because it is good at detecting regularity and randomness in time-series data. We are literally taking the pulse of the planet.
|
|
“Imagine you roll a dice and write down the series of numbers it lands on. You expect these to be random. Say you roll a 1, 6, and 5. If the system has low entropy then we would expect other chunks of rolling 1 followed by 6 to have a higher probability of being followed by a 5. We have applied just that same method to European temperature data.”
|
|
The study shows that some scientific data analysis methods overlook subtle changes in the ‘regularity’ of the temperature data.
|
 |
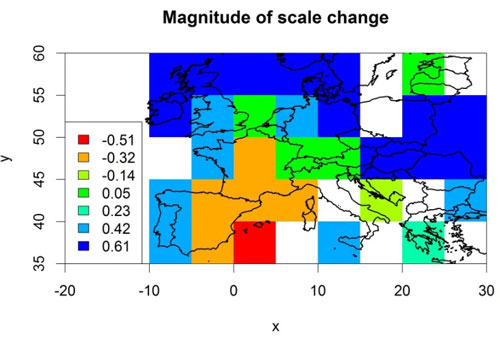
| Map of Central Europe showing where the CRUTEM4v temperature data show a change in entropy. Non-significant values are set to zero. (a) Colours show the largest change in entropy over all scale factors. Negative values show a decrease from 1850-1960 to 1961-2014, positive ones an increase.
|
|
The unique way of analysing the data involves an analysis at several temporal scales. The data are aggregated to scales of months and analysed at each scale separately to find the time-scales at which the regularity of the data changes.
|
|
The researchers analysed the Central European variance-adjusted mean monthly air temperature anomalies (CRUTEM4v) produced at the University of East Anglia.
|
|
The results show that the temporal scales of the current temperatures (1961-2014) are different from the long-term average (1850-1960). At temporal scales longer than 12 months the researchers found a marked loss of regularity in the data for the past 54 years.
|
 |
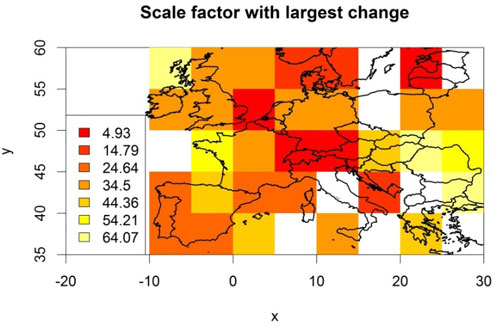
| Map of Central Europe showing where the CRUTEM4v temperature data show a change in entropy. Non-significant values are set to zero. . (b) Temporal scale factor with the largest difference in entropy (in units of months).
|
|
“Interestingly, the changes we found only operated on time-scales longer than about a year. On these time-scales the climate seems to have become less predictable,” says Professor Balzter.
|
|
The study reveals that from 1961 to 2014, at time-scales from 12 to 70 months the air temperatures in Europe show less regularity compared to 1851-1960.
|
|
This may be a sign that the regional temperatures are now influenced by more complex forces at work – and the researchers suggest that it could be possible that climate system feedbacks express themselves in altered temporal scales of European temperatures.
|
|
The study also provides a map visualisation of the entropy results for the first time, showing the time scales which have changed most.
|


