| Posted: May 27, 2009 |
Measuring distances between multicolor quantum dots with true nanometer resolution |
| (Nanowerk Spotlight) In a recent Nanowerk Spotlight we reported on a single molecule approach to directly visualize and map protein binding sites on DNA using fluorescent quantum dots (Quantum dots light up individual DNA binding proteins). One of the challenges the researchers in this work had was to measure distances between probes bound to combed DNA with nanometer resolution. Whereas very short distance (below 10 nm) can be assessed by FRET measurements and distances above the Rayleigh criterion (d > lambda/2) can be measured, say, with a standard microscopy picture and a ruler, distances in between need to be addressed differently. This is were a novel approach by scientists at UCLA fills the gap, and, as they claim, better than other techniques do. |
| "The core of our finding is using quantum dots and scanning-stage confocal microscopy to perform nanometer-distance measurements between individual color probes," Xavier Michalet tells Nanowerk. "Now, nanometer-resolution distance measurement is not new. In fact, our first paper on the subject is almost 10 years old (Ultrahigh-resolution multicolor co localization of single fluorescent probes) and many other teams have contributed a lot of interesting approaches since then. However, so far, measuring distances between single molecular probes of different colors has been plagued by the problem of color registration (and in some cases, chromatic aberration)." |
| Michalet, a scientists at UCLA's Department of Chemistry and Biochemistry, and his collaborators in Shimon Weiss' group had the idea of solving the problem of color registration by dispensing with excitation color and emission filter switching. They report their findings, first authored by Josh Antelman, in a recent edition of Nano Letters (Nanometer Distance Measurements between Multicolor Quantum Dots). |
| "Microscope vendors and others have worked hard to guaranty that imaging a sample with different color fluorescent probes can be done with sub-pixel registration between color planes, but nonetheless, there is still some residual – and what is worse, random – sub-pixel shift, which is sufficient to limit the resolution distance measurements between different color probe to about 10 nm or more," explains Michalet. "There are a few reports, which we cite in our paper, that use similar samples as the one we use to illustrate our technique, and they all report a distance distribution width of this order. We bring ours down to a few nanometers because of our solution and as we show, this could be further reduced with a few simple improvements." |
| Dispensing of excitation color switching is only possible with probes that can be excited by a single laser but emit at different colors. Quantum dots are perfect for that purpose since they have a broad absorption spectrum which makes it possible to excite different color quantum dots with a single laser line, say, the 488 nm line of an Argon laser or the 405 nm line of a diode laser. |
| The UCLA team dispense of emission filter switching – and additionally of beam scanning, which would potentially cause all sorts of optical aberrations – by using a stage-scanning confocal microscopy approach. |
| Antelman explains that in this non-standard approach – commercial microscope use beam scanning instead, moving the beam with mirrors throughout the sample – the sample is moved step by step with nanometer precision using a piezo-scanner. "The fluorescence from the different, or single, probes in the excitation volume is recorded after filtering by one ultrasensitive sensor per color (a single-photon counting avalanche photodiode). All optical elements are fixed, which eliminates issues of reproducibility encountered in other techniques." |
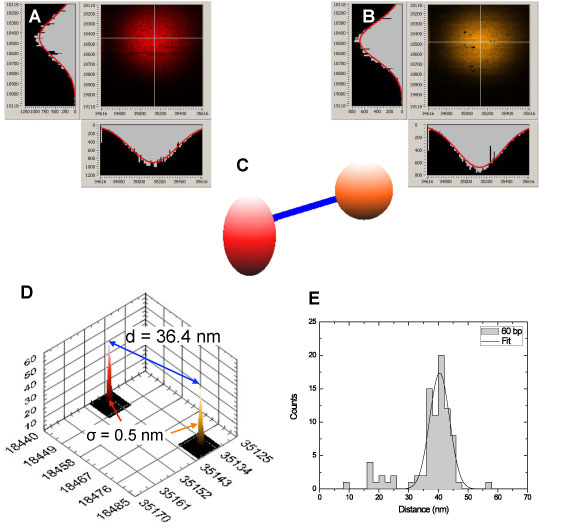 |
| Confocal images of the red (A) and orange (B) quantum dot attached to a 60 bp quantum dot-DNA dimer schematically represented in (C). The fitted centers are indicated by white crosses, and the fitted fluorescence intensity distributions are indicated as red curves on top of the corresponding orthogonal intensity profiles. (D) The analysis for this particular dimer yields a localization uncertainty of 0.5 nm for each quantum dot (the narrow localization peaks) and a distance of 36.4 ± 0.7 nm. (E) Analysis of several such dimer images yields a average distance of 40.4 ± 3.4 nm in perfect agreement with the B-DNA model of the double helix, and the know geometrical characteristics of the quantum dots. (Image: Xavier Michalet/UCLA) |
| The rest of the technique relies on a standard approach consisting in finding the center of the spot image corresponding to each color probe, by fitting its intensity profile with a Gaussian model. This results in sub-nanometer localization of each probe in its color plane. |
| As Michalet points out, the beauty of this technique is that the coordinates obtained for each color probe can be combined directly to compute distances, since they correspond to identical positions of the sample (all color images are acquired simultaneously, and thus each pixel of coordinate, say x,y, in each color plane corresponds to the exact same location in the sample). |
| Although, as mentioned above, the gist of this approach was already presented some 10 years ago, what was missing was a proof of the distance resolution that the researchers were claiming in this first paper (the PNAS paper cited above). In other words, a clean, well-characterized sample. |
| In this new work, Antelman managed to prepare the perfect sample for the demonstration of the technique, namely quantum dot-DNA dimers. He also brought a crucial improvement to the approach: he managed to suppress quantum dot blinking (described in more detail here: Suppression of Quantum Dot Blinking in DTT-Doped Polymer Films), which has boosted the resolution that could be achieved at least fourfold. |
| The team encountered an unexpected limitation, caused by their use of commercial quantum dots (to facilitate the reproduction of their work by others): "The quantum dots we used had a rather broad size and shape dispersion, which created some additional dispersion in our measurements," says Michalet. "However, we fully characterized this effect using TEM images of the quantum dots and a simple geometric model. This analysis leads us to believe that using more monodisperse, rounder quantum dots will allow truly sub-nanometer distance measurements to be performed, something we will explore in the future using our own quantum dots." |
| Besides the gene and protein binding sites mapping applications discussed in the Nanowerk Spotlight mentioned at the beginning, there are many other potential applications of this approach. Although the scientists illustrated their technique using samples deposited on a surface, i.e. making purely two-dimensional measurements, there is no reason why the same approach couldn't be used in three dimensions; something which would be useful to explore the structure of large molecular complexes by triangulation. |
| "The idea here would be to use quantum dots attached to antibodies against different subunits of a molecular complex and map their 3D localization," says Michalet. "This would give a nanometer resolution coarse map of the complex, which could be used to identify components in a higher resolution single-particle cryo-SEM study of the same complex. Also, with the recent progresses of 3D nanotechnology, it could be advantageous to have a technique allowing a characterization of the respective organization of each components, without having to resort to destructive techniques such as SEM or invasive ones such as AFM." |
| Going forward, there are several directions in which the UCLA team intend to improve their technique, and which they are already exploring. Michalet lists three areas: |
| "1) Using more monodisperse quantum dots would allow true sub-nm (Ångström) resolution to be performed. We have been working on smaller quantum dots and thin, versatile peptide coating that would help using this approach without having to worry as much about steric hindrance effects. But potentially other probes than quantum dots could be used as well. |
| 2) As mentioned, the technique can be extended to 3D. There are many tricks that have been devised in recent years to figure out where a single-molecule is located in Z, or how it is oriented, which could be directly incorporated in this multicolor approach. |
| 3) It would be advantageous to speed up the acquisition time. The main limitation is the number of photons that can be acquired (which should be as large as possible) and the number of pixels per single-molecule image (than cannot be too small, but does not really need to be large either). Here, we can probably already now do better than what we show in the paper, but further improvements could be envisioned with even brighter quantum dots and multispot excitation and detection schemes." |
 By
Michael
Berger
– Michael is author of four books by the Royal Society of Chemistry:
Nano-Society: Pushing the Boundaries of Technology (2009),
Nanotechnology: The Future is Tiny (2016),
Nanoengineering: The Skills and Tools Making Technology Invisible (2019), and
Waste not! How Nanotechnologies Can Increase Efficiencies Throughout Society (2025)
Copyright ©
Nanowerk LLC
By
Michael
Berger
– Michael is author of four books by the Royal Society of Chemistry:
Nano-Society: Pushing the Boundaries of Technology (2009),
Nanotechnology: The Future is Tiny (2016),
Nanoengineering: The Skills and Tools Making Technology Invisible (2019), and
Waste not! How Nanotechnologies Can Increase Efficiencies Throughout Society (2025)
Copyright ©
Nanowerk LLC
|

Become a Spotlight guest author! Join our large and growing group of guest contributors. Have you just published a scientific paper or have other exciting developments to share with the nanotechnology community? Here is how to publish on nanowerk.com. |
