| Posted: |
|
|
| Meristem cells were imaged by confocal optical microscopy integrated with the BioScope Catalyst™, and an area of interest was selected to perform the AFM measurements (rectangular area in Figure 4A) through the MIRO® software interface. Anticlinal cell walls (normal to the surface) are thought to be much stiffer than the rest of the cells. Fluorescence labeling of the cell walls with a lipophilic dye allowed easy identification of their location within the meristem for correlation to AFM modulus measurements (see Figure 4A). The same meristem cells were imaged in PeakForce QNM mode. This type of tissue is quite bumpy, with many relatively tall features (up to 10µm) but it can easily be imaged using Bruker’s ScanAsyst® mode (also based on PeakForce Tapping technology) with full automatic optimization of imaging parameters. In Figure 4B, the topography in the area of interest is rendered in 3D showing ~50 cells. In Figure 4C the 3D topographic surface was recolored based on the elastic modulus map of the area (softer areas are darker), clearly indicating that the cell walls are much stiffer than the cell core. While moduli can be influenced by the topography of a surface (valleys sometimes appear to be stiffer than peaks because the contact area with the tip is greater), this was not a significant bias in this measurement. Indeed, green circles show areas where there are divided cells presenting newly synthesized cell walls observable in the confocal and modulus maps, but not in the topographic map. This type of study illustrates the potential of PeakForce QNM to investigate the mechanical changes of plant cell walls during development, opening possibilities to relate local biophysical parameters to the global shape of the tissue in the presence of hormones, drugs, or in a modified genetic background.19 |
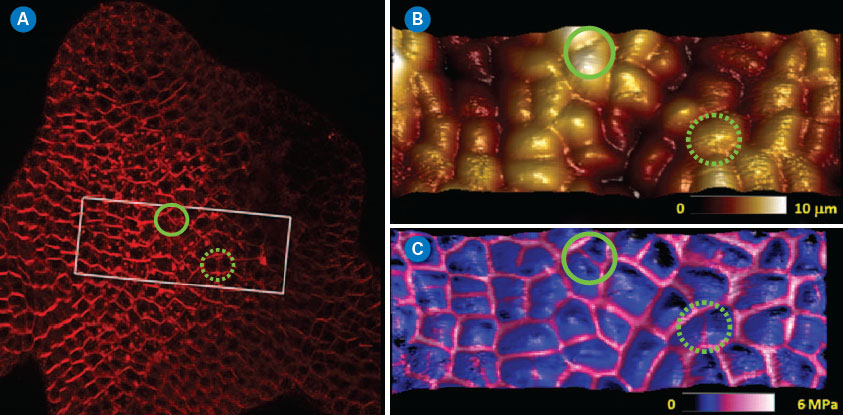 |
| Figure 4. Typical application of PeakForce QNM imaging on living plant cells. (A) Projection from a confocal stack of an Arabidopsis Thaliana shoot apical meristem. Membranes were labeled with FM4-64. (B and C) PeakForce QNM images (top: 3D-height, topography only; bottom: 3D-height with DMT modulus skin). The DMT modulus channel clearly indicated that the cell edges (anticlinal cell walls) were significantly stiffer than the rest of the cell. Circled areas show regions where the modulus and optical maps reveal the presence of anticlinal cell walls that are not detected when using topography alone. (click image to enlarge) |
| Force Volume vs. PeakForce QNM on Live Cells |
| Many phenomena relating to the lifecycle and behavior of cells and tissues are related to cell mechanics or the mechanics of the constituent parts of the cell. Force volume and PeakForce QNM mapping are both valuable tools when investigating phenomena such as cell migration and cell division or when using cell mechanics to detect cancer or disease. The faster, higher resolution mapping made possible with PeakForce QNM allows more detailed mapping of these processes as they occur. The limited duration of these processes and cell lifetime make speed of acquisition a critical component of many experiments. Figure 5 demonstrates the resolution possible on the lamellipodium of a mouse B16 cell imaged in HEPES buffer. This image was collected in 8.5 minutes. A similar force volume map collected at a ramp rate of 2Hz with the same resolution would take about 9 hours. |
| Figure 5B and 5C compare modulus maps calculated from the DMT (sphere) model using the retract curves and the Sneddon (cone) model using the approach curves. The substrate (upper right of both images) is saturated since the cantilever spring constant of the probe used is too small to provide quantitative modulus on the much stiffer surface of the glass bottom Petri dish. The DMT modulus map is brighter than in the Sneddon map, with the Sneddon map being more accurate since the deformation depth on the cell was between 100 and 200nm (tip radius is ~30nm, so the tip shape can be approximated by that of a cone). To demonstrate the difference, a single curve was extracted from the PeakForce Capture data and analyzed with both the DMT model (B) and the Sneddon model (C). Comparing the green fit curve to that of the data, it is easy to see that the Sneddon model fits the data much better than the DMT model. |
| During image acquisition, force curves (similar to those in Figure 5B and 5C) were collected and analyzed along with the topography, providing the simultaneous maps of DMT modulus, Sneddon modulus, peak force error, deformation, dissipation, and adhesion. Figure 5D shows six more of these maps. Details such as the actin fibrils in the cell cytoskeleton are visible in many of the channels, but there are differences. For example, the peak force error channel and deformation channel show many small fibrils, while fewer fibrils are visible in the modulus channels, and none are visible in the adhesion map. |
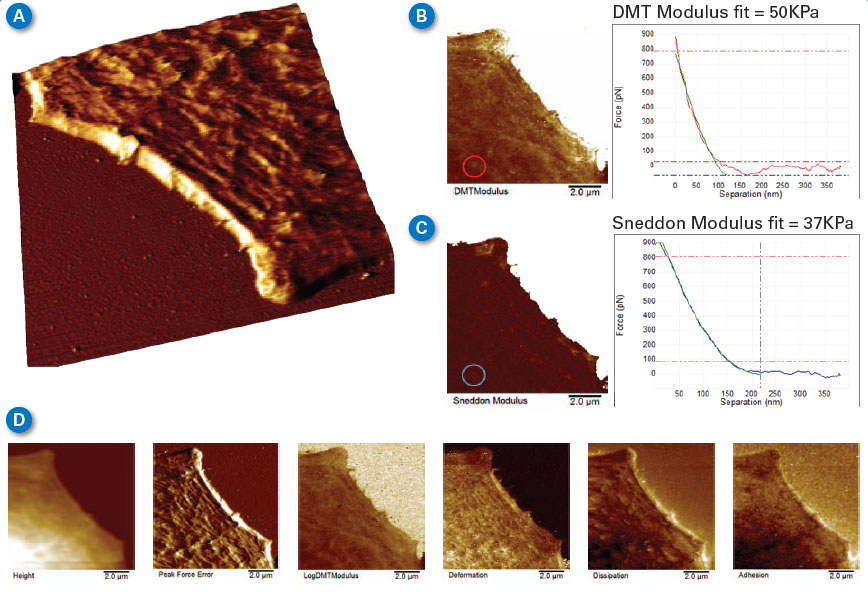 |
| Figure 5. Lamellipodium of a mouse B16 cell imaged in HEPES buffer. (A) 3D rendering of the lamellipodium topography showing actin fibrils. (B,C) Comparison between maps of DMT modulus and Sneddon modulus, along with individual curves and fits from the same point in the image. (D) Six additional data channels collected simultaneously, mapping the properties of the cell, such as deformation, dissipation, and adhesion. (Classic MLCT-D K=0.048N/m, tip with 35-degree half angle, R~30nm end radius, modulation amplitude of 200nm at 250KHz to minimize viscous background, setpoint 1nN.) (click image to enlarge) |
| While PeakForce QNM can correct for some background deflection not related to the short range tip-sample interaction, it is not always possible to correct all of the background in fluid due to variation of apparent liquid viscosity near the sample surface. For highest measurement accuracy, it is best to minimize this viscous background by using the smallest modulation amplitude possible and <1kHz modulation frequency. These images were collected with modulation amplitude of 200nm at 250kHz. The probe was also selected with the viscous background in mind. The classic MLCT-D probes have fairly small cantilever surface area, with a moderately low spring constant of 0.048N/m. Tip geometry was pyramidal with 35 degree half angle and R~30nm end radius. |
| Force volume is well accepted as a tool for studying the mechanical properties of cells at ramp rates of less than 10–20Hz. Figure 6 compares the Sneddon modulus maps from Figure 5 with those from force volume at 1Hz and 5Hz, and with PeakForce Capture (PFC) results at 250Hz. All of the maps show that the cell’s lamellipodium has about the same modulus (compare the color of the lower left part of each image in 6A and 6C) independent of ramp rate and technique. Figure 6B shows a histogram of all of the images, showing that all of the peaks are around 20kPa. The lack of variation indicates that there is very little viscoelasticity or any other time-dependent deformation mechanism active in the range of frequency between 1Hz and 250Hz for the lamellipodium of this cell. |
 |
| Figure 6. Comparison of Sneddon modulus values obtained with PeakForce QNM and force volume at two different ramp rates. (A) 256x256 pixel map of Sneddon modulus calculated simultaneously with topographic imaging. Note actin fibrils clearly visible in cytoskeleton. (B) Histogram of modulus on the lamellipodium at different ramp rates. Green line is from 250Hz PeakForce QNM image, blue diamonds are force volume at 5Hz, red squares are force volume at 1Hz, Xs are from 250Hz PeakForce Capture data calculated offline. (C) Force volume images at 1Hz (top) and 5Hz (middle) and PeakForce Capture (PFC) image at 250Hz (bottom). All images are plotted with same data scale and color bar with range -50 to +300KPa for all. (click image to enlarge) |
| The force volume images were collected at low resolution (16x16 pixels) to save time, but the resulting modulus maps do not have enough resolution to clearly identify the actin fibrils in the cytoskeleton that are visible in the PeakForce Capture and PeakForce QNM images. |
| Continue to next page (4 of 4) |
|
|

Become a Spotlight guest author! Join our large and growing group of guest contributors. Have you just published a scientific paper or have other exciting developments to share with the nanotechnology community? Here is how to publish on nanowerk.com. |
