| Jun 10, 2026 |
Nanosensor patches detect fungal toxin before plants show diseaseMicroneedle nanosensor patches detect fusaric acid in living plants, revealing fungal infection before visible symptoms appear. |
| (Nanowerk Spotlight) The best biomarker of a crop disease may appear before the plant gives any visual clue, but the tools that can read that biomarker usually require removing the tissue one wants to monitor. Molecular warning signs can be present while leaves and stems still look healthy. Yet the standard tests for those early molecules usually begin by cutting material from the plant. |
| For instance, Fusarium fungi release fusaric acid inside infected plants before wilting, yellowing, or stunted growth appear. Chromatography and mass spectrometry can measure the toxin precisely, but they require destructive sample preparation and cannot track the same living tissue in place. A useful early-warning sensor must reach plant fluid without cutting out tissue, and its signal must remain reliable inside complex plant tissue. |
| A study published in Advanced Materials ("Ratiometric Mycotoxin Detection in Living Plants With Dual‐Emissive Nanosensors") reports a microneedle patch that samples fluid from living plants and detects fusaric acid in place. The patch carries fluorescent carbon dots inside a porous zinc-based metal-organic framework. The material emits two colors from the same sensor. Fusaric acid dims the blue signal, while the red signal provides a reference for sensor amount, illumination strength, and sampling variation. |
| The patch does not diagnose fusaric acid from blue brightness alone. It measures whether the blue signal has dropped relative to the red signal produced by the same sensor. Weak blue fluorescence could also come from uneven tissue contact, variable sensor loading, or light scattering inside the plant. The red channel changes little in response to fusaric acid, so it gives the blue channel a local reference point. |
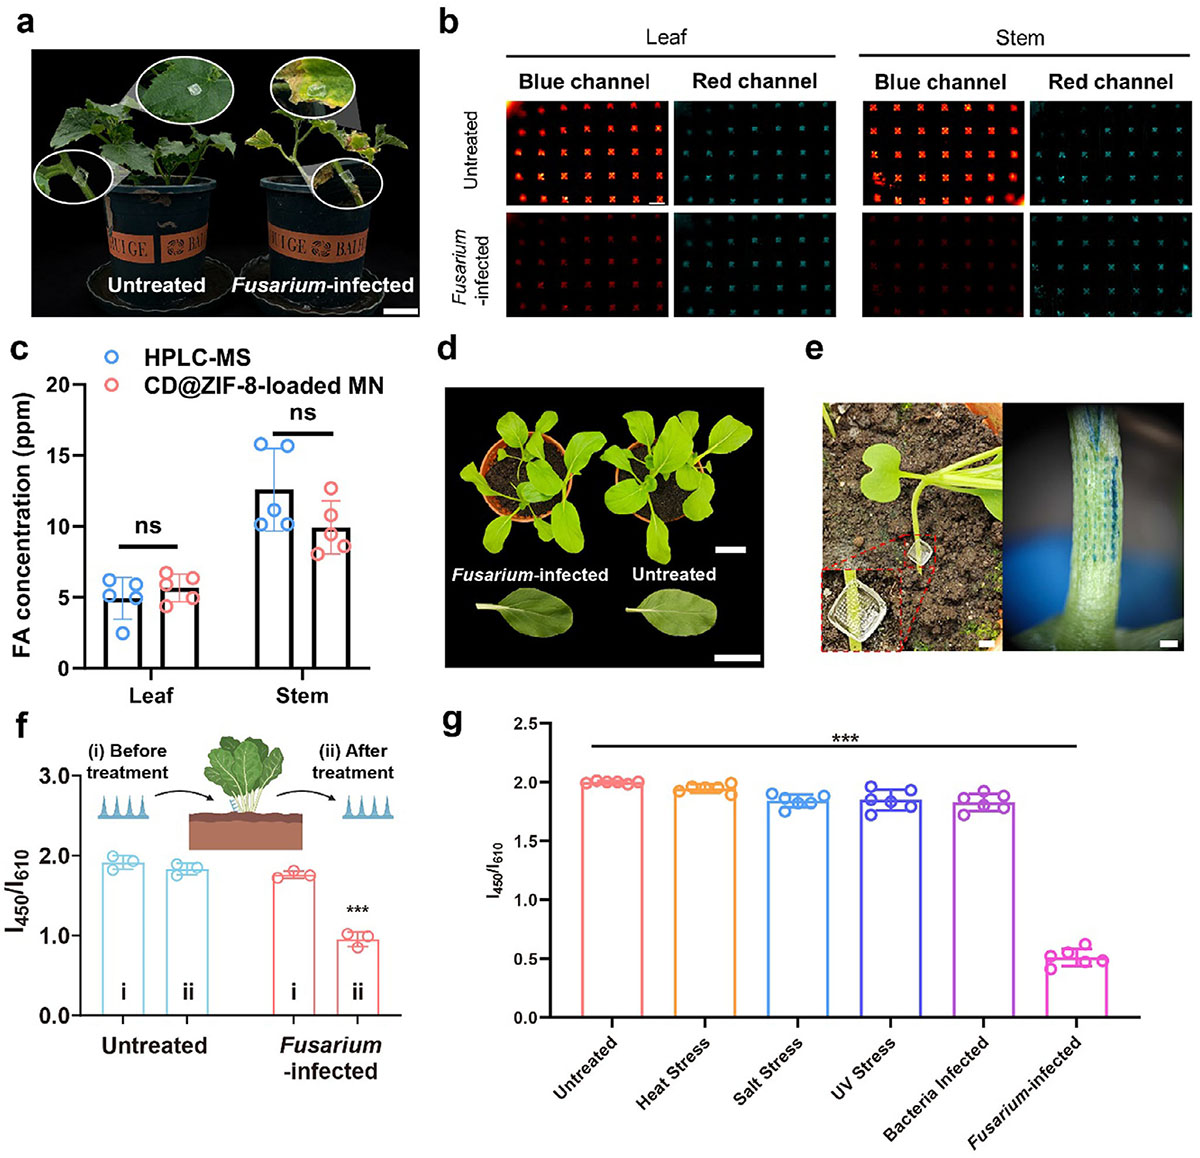 |
| (a) Representative images of untreated and F. oxysporum-infected plants, along with magnified views of microneedle-based in situ detection sites (scale bar: 10 cm). (b) Representative fluorescence images of microneedle-based in situ detection on leaves and stems of untreated and F. oxysporum-infected plants in the blue (Ex./Em. 365 nm/420 – 480 nm) and red (Ex./Em. 561 nm/600 – 650 nm) emission channels. (scale bar: 400 µm). (c) Comparison of FA concentrations determined by HPLC and the CD@ZIF-8-loaded MN method. Images are representative of n = 5 independent samples. (d) Comparison of untreated and F. oxysporum-infected plants, showing negligible phenotypic differences between healthy and infected leaves (scale bar: 5 cm). (e) Verification of microneedle penetration into plant tissue: (left) photograph of microneedles inserted into the plant leaf, scale bar: 5 mm, and (right) 0.4% trypan blue staining of the puncture sites, with blue-stained regions confirming successful insertion, scale bar: 500 µm. (f) Changes in fluorescence intensity at 450 nm and 610 nm before and after microneedle insertion into the plant stem (n = 3 independent samples). The inserted scheme is partially created in BioRender. Lew, T.T.S. (2026) https://BioRender.com/119x1nu. (g) Quantitative analysis of the fluorescence intensity ratio I450/I610 of the microneedle array under various stress treatments (n = 6 independent samples). (Image: Reproduced from DOI:10.1002/adma.73624, CC BY) (click on image to enlarge) |
| Earlier work on carbon nanotube nanosensors that alert a smartphone when plants are stressed showed how optical nanomaterials can report internal plant chemistry before symptoms are obvious. Here, a weaker blue signal should mean fusaric acid, not uneven contact or a changing optical background. The red reference gives the patch a way to make that distinction. |
| CD@ZIF-8 supplies the paired signal by holding fluorescent carbon dots inside ZIF-8, a porous framework built from zinc ions and organic linkers. Carbon dots can emit different colors depending on their local environment. By tuning how many dots stayed separated and how many clustered inside the framework, the team made one particle produce both blue and red fluorescence. |
| Separated dots produce the blue signal. Clustered dots produce red light through aggregation-induced emission, where clustering supports fluorescence rather than suppressing it. Because both signals come from the same particle, the blue response can be compared with a red reference collected from the same sampled region. The toxin-sensitive signal and the reference signal travel together into the plant. |
| Fusaric acid affects those two dot populations differently. The toxin can bind zinc sites in the ZIF-8 framework, which appears to partly disrupt the structure around the carbon dots. Once exposed, separated dots appear to interact with fusaric acid in a way that suppresses their blue fluorescence. Clustered dots keep their red emission, so the toxin changes the blue-to-red ratio. |
| Plant fluid contains sugars, amino acids, hormones, organic acids, salts, and other molecules that can interfere with fluorescence. The nanosensor responded much more strongly to fusaric acid than to representative plant metabolites. Extracts from maize, cucumber, pak choi, and wheat also left the ratio stable unless the researchers added fusaric acid, suggesting that the signal can survive different plant chemical backgrounds. |
| The selectivity has limits. Some molecules with structures similar to fusaric acid, including picolinic acid and 2,5-pyridinedicarboxylic acid, also quenched the sensor in laboratory tests. The paper argues that these compounds occur at much lower concentrations in plants than fusaric acid, so they should not dominate the response in the tested disease setting. The claim is practical selectivity in plant diagnosis, not chemical uniqueness under every condition. |
| To bring the sensor to living tissue, the researchers embedded the CD@ZIF-8 particles in polyvinyl alcohol microneedles, creating a patch that can pierce plant surfaces and absorb interstitial fluid with limited damage. Related plant-interface research has explored microneedles for plant monitoring and biofortification, where tiny needles can serve as access points for plant tissues. |
| In artificial plant sap, the microneedle patches preserved the nanosensor’s two-color behavior. Within 5 min of fusaric acid exposure, blue fluorescence decreased while red fluorescence remained stable. As toxin concentration increased, the blue-to-red ratio changed accordingly. Embedding the particles in the polymer patch did not blunt the blue-to-red response. |
| In cucumber plants with advanced Fusarium oxysporum infection, the patch readout agreed with high-performance liquid chromatography and mass spectrometry. Both methods measured about 4 to 6 ppm fusaric acid in stems and about 9 to 13 ppm in leaves. Infected tissue contains many biochemical changes besides the target toxin, so the agreement helped rule out unrelated fluorescence changes. |
| Pak choi plants grown in Fusarium-contaminated soil still looked similar to healthy controls after 3 weeks, but the sensor read a difference their leaves did not show. Extracts from infected plants caused a strong drop in the blue-to-red ratio. When the microneedle patch touched living stems directly, infected plants produced about a 30 % lower ratio than healthy plants. |
| Heat, salt, ultraviolet exposure, and bacterial infection with Xanthomonas campestris caused little change compared with the response to Fusarium. Crops rarely face one stress at a time, so a sensor that reports general damage would have limited diagnostic value. The response remained tied to the fungal toxin marker rather than to stress in general. |
| The microneedles puncture the plant surface, so the relevant test was whether that contact altered plant function. Leaves treated with sensor-loaded microneedles maintained chlorophyll content, cell viability, and photosynthetic performance close to untreated controls. A damaging surfactant control caused clear injury, which helped distinguish limited microneedle puncture from broader physiological injury. The sensor also kept its two-color fluorescence after storage in air and after hydration. |
| Field use would require more than a sensitive fluorescent material. The patch would have to keep its two-color response stable through greenhouse and outdoor conditions, and manufacturers would have to produce uniform microneedle arrays at larger scale. The readout would also have to move beyond laboratory imaging toward portable or wireless systems that translate the optical ratio into usable diagnostic information. |
| The study brings the necessary pieces into one plant-compatible platform: a toxin-sensitive blue signal, a red reference signal from the same nanosensor, and microneedles that sample living tissue without removing it. If those pieces can be made durable and scalable, fungal diagnosis could shift from destructive confirmation after symptoms appear to earlier monitoring based on chemical evidence inside the plant. |
 By
Michael
Berger
– Michael is author of four books by the Royal Society of Chemistry:
Nano-Society: Pushing the Boundaries of Technology (2009),
Nanotechnology: The Future is Tiny (2016),
Nanoengineering: The Skills and Tools Making Technology Invisible (2019), and
Waste not! How Nanotechnologies Can Increase Efficiencies Throughout Society (2025)
Copyright ©
Nanowerk LLC
By
Michael
Berger
– Michael is author of four books by the Royal Society of Chemistry:
Nano-Society: Pushing the Boundaries of Technology (2009),
Nanotechnology: The Future is Tiny (2016),
Nanoengineering: The Skills and Tools Making Technology Invisible (2019), and
Waste not! How Nanotechnologies Can Increase Efficiencies Throughout Society (2025)
Copyright ©
Nanowerk LLC
|

Become a Spotlight guest author! Join our large and growing group of guest contributors. Have you just published a scientific paper or have other exciting developments to share with the nanotechnology community? Here is how to publish on nanowerk.com. |
