| Posted: |
(page 2 of 4) |
| Figure 2A shows a pair of E. coli bacteria rendered in 3D (based on the topography of the sample) with the brightness of the image based on the Young’s modulus. This image was collected using PeakForce QNM in about 10 minutes. This is in contrast to the force volume image in Figure 2C, which took about 35 minutes to collect. The improvement in speed is convenient and allows more and higher resolution images (256x256 vs. 64x64 in this case) to be collected during the life of a cell. The bacteria are still alive during imaging (in liquid at room temperature) and the one on the right appears to be in the process of dividing. Note that the dividing cell on the right is significantly softer than the cell on the left (~2MPa vs. ~15MPa). Much of the substrate is too stiff to accurately measure under the same conditions as the bacteria, but note the presence of some softer components, including the bacterial flagella in the lower-right corner. For these images, the modulus was calculated using the Sneddon (conical) model assuming a tip with an 18 degree half angle (typical for the DNP-A type of probe that was used). |
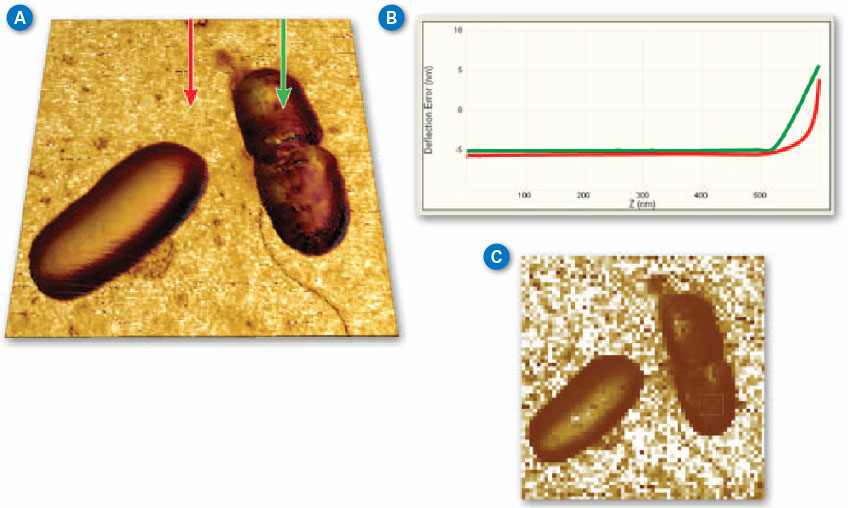 |
| Figure 2. (A) PeakForce QNM (250Hz) Sneddon modulus data painted on 3D topography of E. coli bacteria. Brighter areas are stiffer with the brightest areas (substrate) ~50MPa. (B) Two force curves from the PeakForce Capture file showing the difference between substrate and cell. (C) Force volume Sneddon modulus image of the same bacteria collected at a ramp rate of 2Hz. (Standard DNP-A probe in water with 300nm modulation amplitude, Scan size 5µm.) (click image to enlarge) |
| It is often useful to examine individual force curves from interesting parts of the image. PeakForce Capture allows the simultaneous capture of the force curves that are used to create the property maps in PeakForce QNM. As before, the images are calculated and captured normally, but a force curve for each pixel in the property map is saved separately in a Quantitative Force-Volume file format. These files can be opened in NanoScope analysis for additional exploration with the full Quantitative Force-Volume analysis tools. It is easy to examine or export individual curves or sets of curves. Additionally, calibration parameters can be adjusted and different property models can be compared (e.g., DMT vs. Sneddon). Since the same tools are used to analyze both force volume and PeakForce Capture files, it is simple to contrast results collected at ramp rates from 0.1-10Hz (force volume) to those at ramp rates from 250Hz and higher (PeakForce Capture). This allows investigation of the time dependence of the tip sample interaction. |
| Figure 2B shows a pair of force curves (approach only) from PeakForce Capture. One was collected on top of the cell, while the other was collected on the sample substrate as indicated in Figure 2A. The slope of the curve from the substrate (red) is initially smaller than that of the bacteria, but it increases rapidly, becoming nearly vertical at the most extended point. This occurs because there is a soft, thin gelatin coating on the substrate that is intended to aid immobilization of the bacteria cells. When the tip penetrates deeper into the gelatin, it begins to feel the underlying glass substrate, which is much stiffer than the cells. The curve collected on the cell (green) is more uniform in slope, indicating that the substrate is not influencing the measurement significantly. The ability to access the individual curves creates significant opportunities for additional exploration and understanding. |
| Probing Agarose Gels at Various Ramp Rates |
| Agarose is a polysaccharide derived from agar. It is most widely used as a medium for gel electrophoresis measurements but it is seeing more recent applications as a tissue mimicking material (e.g., tissue phantoms).12–15 The mechanical properties of agarose gels are concentration dependent, with higher agarose concentrations resulting in “stiffer” gels. This allows preparation of agarose gels having different elastic modulus values in the biologically relevant range of tens to thousands of kilopascals. To demonstrate the ability of force volume and PeakForce QNM to measure these very soft samples, gels from 1%-5% wt. were prepared and imaged in PBS buffer. In Figure 3A, typical approach curves collected on the 3% agarose sample with ramp rates from 1Hz (force volume) to 250Hz (PeakForce QNM) are overlaid on the same plot to demonstrate the similarity between results from the two techniques, even over several orders of magnitude of ramp rate. If Sneddon modulus is calculated for each of these curves, the results are 1Hz: 353kPa, 5Hz: 340kPa, 10Hz: 357kPa, 250Hz: 351kPa. These results are essentially identical within the uncertainty of the measurement. |
| Figure 3C shows the same thing in a more statistically relevant way. The force volume results (1Hz) are shown in green with the PeakForce QNM results at 250Hz in red. The PeakForce QNM histogram provides much better statistics since it is based on 16,384 (128x128) measurements compared to 256 (16x16) measurements for force volume. Despite the large difference in number of samples, the acquisition time is similar: ~11 minutes for PeakForce QNM vs. 4 minutes for force volume. Thus, PeakForce QNM provides significantly better statistics than force volume, at minimal cost. The Young’s modulus can be calculated by directly analyzing the color contrast of the captured images (bearing analysis) or by exporting and processing the selected force curves, using the NanoScope Analysis Force package features (see Figure 1C). When thousands of curves are involved, automated analysis becomes critical. |
| If the sample has a significant time-dependent deformation mechanism, such as viscoelasticity, the results of force volume and PeakForce QNM may be different. This is because the time dependence allows different amounts of deformation at the time scale of the ramp. In Figure 3(B-D) we see that there is very little difference between measurements at 250Hz (PeakForce QNM) and 1Hz (force volume) for the 1% and 3% gels, but the 5% gel has some increase in modulus at higher frequencies. Note that the Sneddon and DMT models only include elastic deformation mechanisms (without time dependence). To quantify this time-dependent behavior, new analysis techniques are needed. The new MATLAB toolbox in NanoScope Analysis is a great tool for researchers interested in developing these techniques. |
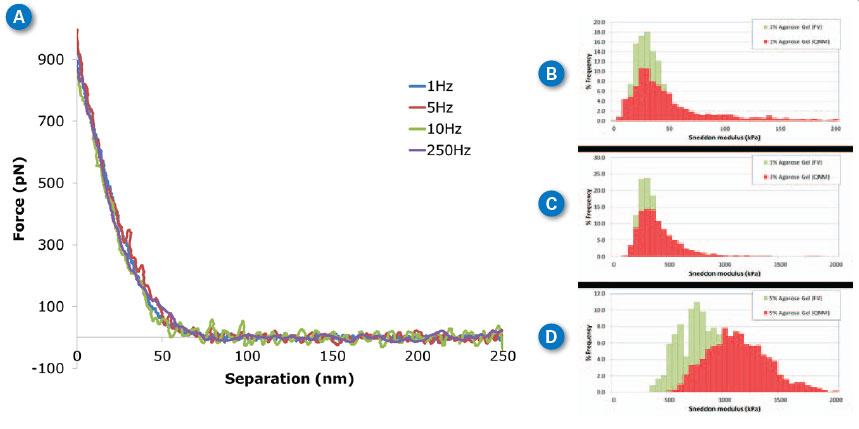 |
| Figure 3. Agarose gels at different ramp rates. (A) Individual curves collected on 3% agarose gel at different ramp rates between 1Hz and 250Hz. (B-D) Histograms of Sneddon modulus results on 1%-5% agarose gel respectively, comparing ramp rates of 1Hz with force volume (green) and 250Hz with PeakForce QNM (red). MLCT-D probe, k=0.047N/m, 1nN trigger, ramp size 300nm. (click image to enlarge) |
| PeakForce QNM to Study Plant Morphogenesis |
| Morphogenesis in biology (i.e., development of an organism’s shape) is a complex mechanism controlled by biochemical factors, themselves dependent on gene expression, and on biophysical factors. Unlike animals where morphogenesis is based on cell division, cell growth, cell migration and apoptosis, plant morphogenesis in young tissues only results from cell division and elongation. The shape of plant cells is governed by the turgor pressure inside the cells and by the mechanical anisotropy and stiffness of the extra-cellular matrix (cell wall). Because of this relative simplicity, plants are ideal systems to study the role of nanomechanics in the morphogenesis of multicellular organisms. |
| In plants, morphogenesis mostly depends on a pool of stem cells localized in specialized plant tissues called meristems, which determine the shape and location of organs (flowers and leaves) and keep the plants growing. Meristems can produce organs over the entire lifetime of the plant, and are physically accessible. Because they control the number, type, and position of the lateral organs, meristems also largely determine key agronomic features such as fruit size, biomass, flowering period, and leaf number. Therefore, getting a better insight into their mechanical properties at the micro- or nanometer scale is of high interest, both for fundamental research and in the agribusiness.16–18 |
| Continue to next page (3 of 4) |
|
|

Become a Spotlight guest author! Join our large and growing group of guest contributors. Have you just published a scientific paper or have other exciting developments to share with the nanotechnology community? Here is how to publish on nanowerk.com. |
