| Nov 02, 2021 |
The science everyone needs to know about climate change, in 6 charts
|
|
(Nanowerk News) With the United Nations’ climate conference in Scotland turning a spotlight on climate change policies and the impact of global warming, it’s useful to understand what the science shows.
|
|
I’m an atmospheric scientist who has worked on global climate science and assessments for most of my career. Here are six things you should know, in charts.
|
What’s driving climate change
|
|
The primary focus of the negotiations is on carbon dioxide, a greenhouse gas that is released when fossil fuels – coal, oil and natural gas – are burned, as well as by forest fires, land use changes and natural sources.
|
|
The Industrial Revolution of the late 1800s started an enormous increase in the burning of fossil fuels. It powered homes, industries and opened up the planet to travel. That same century, scientists identified carbon dioxide’s potential to increase global temperatures, which at the time was considered a possible benefit to the planet. Systematic measurements started in the mid-1900s and have shown a steady increase in carbon dioxide, with the majority of it directly traceable to the combustion of fossil fuels.
|
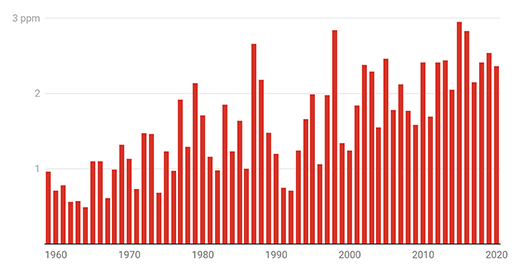 |
| How much the CO2 concentration increased each year. When human activities release more carbon dioxide than nature can remove, the atmospheric CO2 concentration rises. In 2020, despite lower emissions during the pandemic, the concentration still rose by 2.4 parts per million. The chart shows by how much the concentration increased each year over the past six decades. (Chart: The Conversation/CC-BY-ND Source: NOAA Global Monitoring Lab) (click on image to enlarge)
|
|
Once in the atmosphere, carbon dioxide tends to stay there for a very long time. A portion of the carbon dioxide released through human activities is taken up by plants, and some is absorbed directly into the ocean, but roughly half of all carbon dioxide emitted by human activities today stays in the atmosphere — and it likely will remain there for hundreds of years, influencing the climate globally.
|
|
During the first year of the pandemic in 2020, when fewer people were driving and some industries briefly stopped, carbon dioxide emissions from fuels fell by roughly 6%. But it didn’t stop the rise in the concentration of carbon dioxide because the amount released into the atmosphere by human activities far exceeded what nature could absorb.
|
|
If civilization stopped its carbon dioxide-emitting activities today, it would still take many hundreds of years for the concentration of carbon dioxide in the atmosphere to fall enough naturally to bring the planet’s carbon cycle back into balance because of carbon dioxide’s long life in the atmosphere.
|
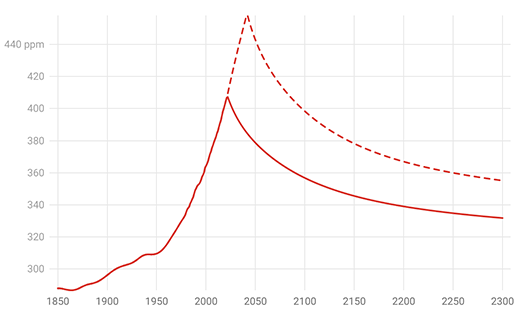 |
| How long does CO2 stay in the atmosphere? If people completely stopped burning fossil fuels in 2021, models estimate the atmospheric CO2 concentration would decline slowly, taking over a century to return to even 1980s levels. Waiting 20 years to stop all emissions would take much longer, as the dashed line shows. (Image: Chart: Pieter Tans)
|
How we know greenhouse gases can change the climate
|
|
Multiple lines of scientific evidence point to the increase in greenhouse emissions over the past century and a half as a driver of long-term climate change around the world. For example:
|
|
Laboratory measurements since the 1800s have repeatedly verified and quantified the absorptive properties of carbon dioxide that allow it to trap heat in the atmosphere.
Simple models based on the warming impact of carbon dioxide in the atmosphere match historical changes in temperature.
Complex climate models, recently acknowledged in the Nobel Prize for Physics, not only indicate a warming of the Earth due to increases in carbon dioxide but also offer details of the areas of greatest warming.
|
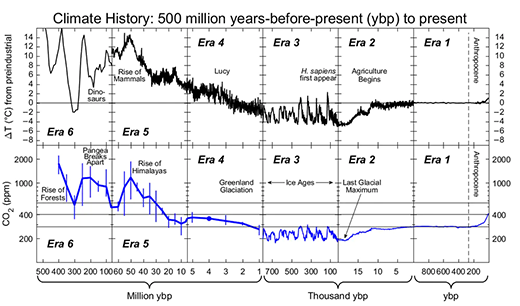 |
| When carbon dioxide levels have been high in the past, evidence shows temperatures have also been high. (Image: Based on Salawitch et al., 2017, updated with data to the end of 2020, CC BY) (click on image to enlarge)
|
Long-term records from ice cores, tree rings and corals show that when carbon dioxide levels have been high, temperatures have also been high.
Our neighboring planets also offer evidence. Venus’ atmosphere is thick with carbon dioxide, and it is the hottest planet in our solar system as a result, even though Mercury is closer to the sun.
Temperatures are rising on every continent
|
|
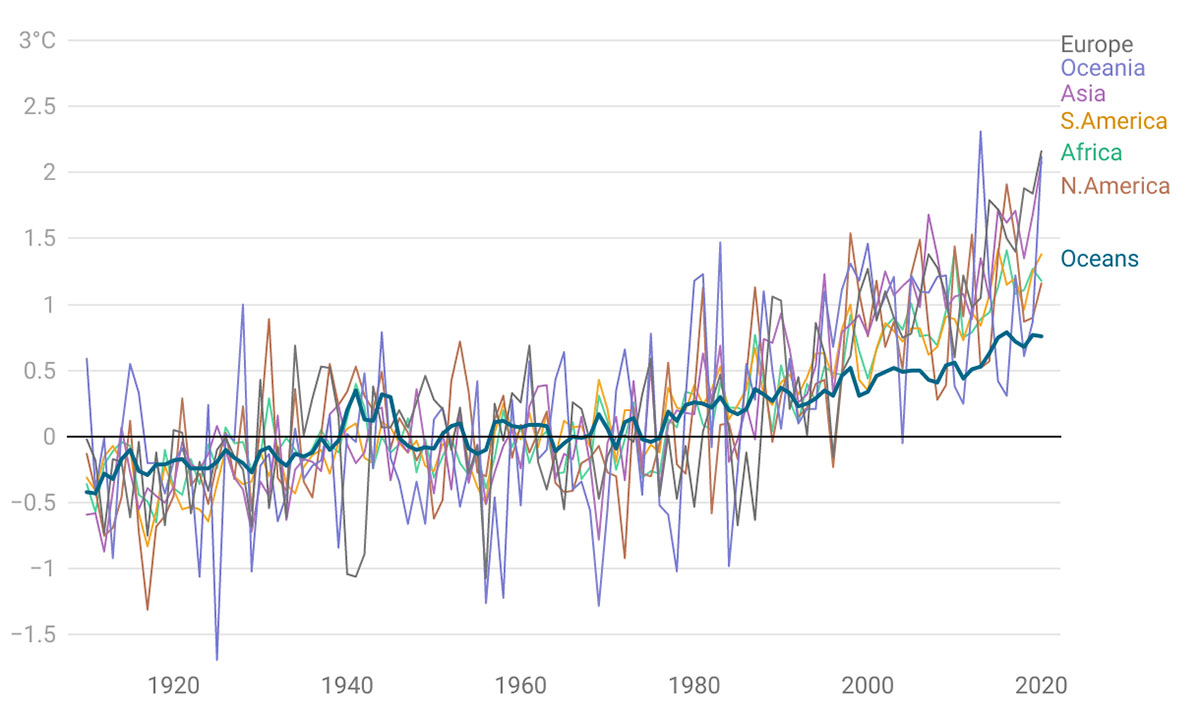
The rising temperatures are evident in records from every continent and over the oceans.
|
|
The temperatures aren’t rising at the same rate everywhere, however. A variety of factors affect local temperatures, including land use that influences how much solar energy is absorbed or reflected, local heating sources like urban heat islands, and pollution.
|
|
The Arctic, for example, is warming about three times faster than the global average in part because as the planet warms, snow and ice melt makes the surface more likely to absorb, rather than reflect, the sun’s radiation. Snow cover and sea ice recede even more rapidly as a result.
|
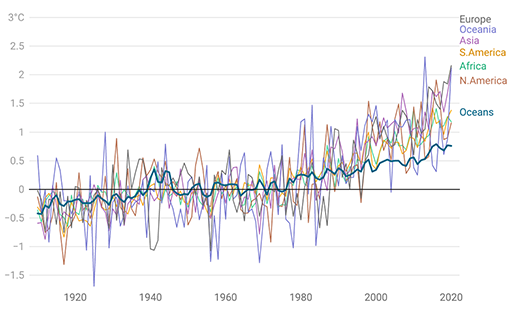 |
| How temperatures have risen over time around the world. Every continent has warmed over the past century, though not at the same rate. The lines show the difference between each continent's average annual temperature and the 1910-2000 average. The ocean is also warming but not as quickly. Baseline is the 1910-2000 average. (Chart: The Conversation/CC-BY-ND Source: NOAA) (click on image to enlarge)
|
What climate change is doing to the planet
|
|
Earth’s climate system is interconnected and complex, and even small temperature changes can have large impacts – for instance, with snow cover and sea levels.
|
|
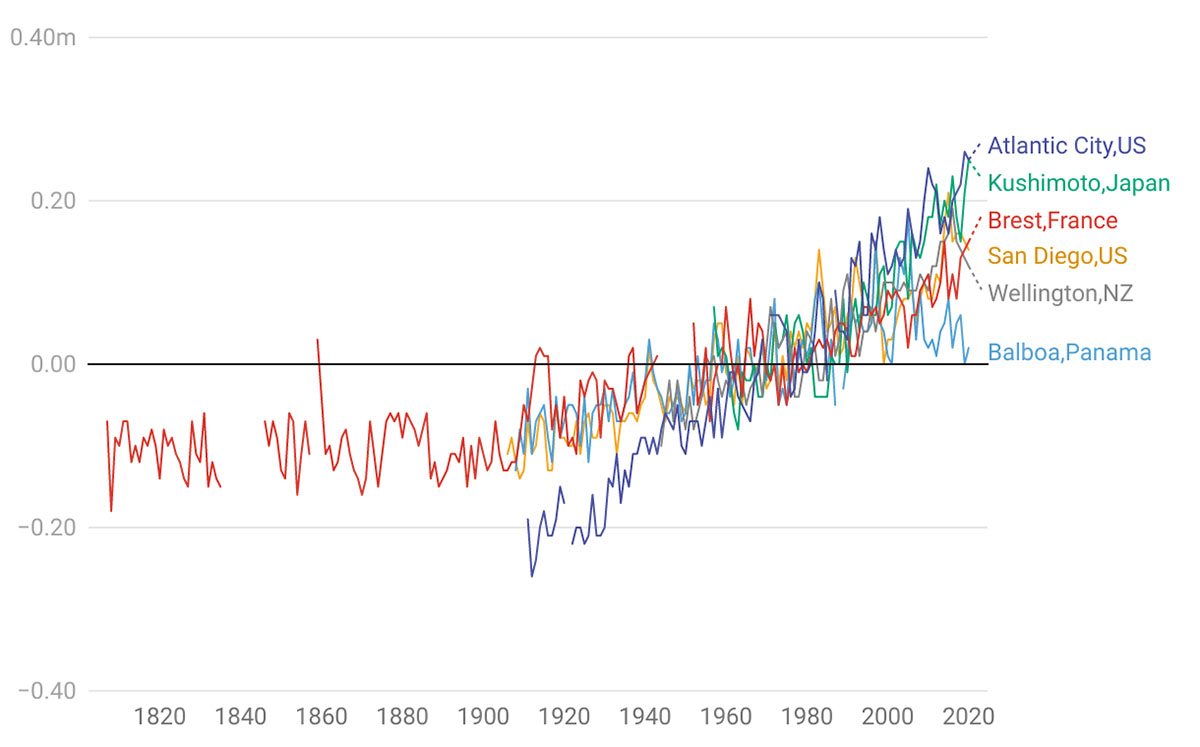
Changes are already happening. Studies show that rising temperatures are already affecting precipitation, glaciers, weather patterns, tropical cyclone activity and severe storms. A number of studies show that the increases in frequency, severity and duration of heat waves, for example, affect ecosystems, human lives, commerce and agriculture. Historical records of ocean water level have shown mostly consistent increases over the past 150 years as glacier ice melts and rising temperatures expand ocean water, with some local deviations due to sinking or rising land.
|
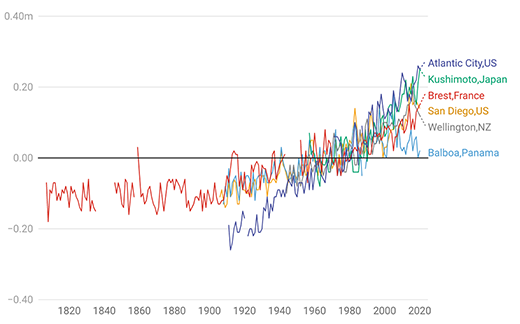 |
| Sea level has risen in coastal cities around the world. Melting glaciers and the thermal expansion of ocean water are causing sea level to rise. Rising and sinking local land masses can also affect the apparent sea level. In meters relative to each site's local 1961-1979 average. (Chart: The Conversation/CC-BY-ND Source: Permanent Service for Mean Sea Level) (click on image to enlarge)
|
|
While extreme events are often due to complex sets of causes, some are exacerbated by climate change. Just as coastal flooding can be made worse by rising ocean levels, heat waves are more damaging with higher baseline temperatures.
|
|
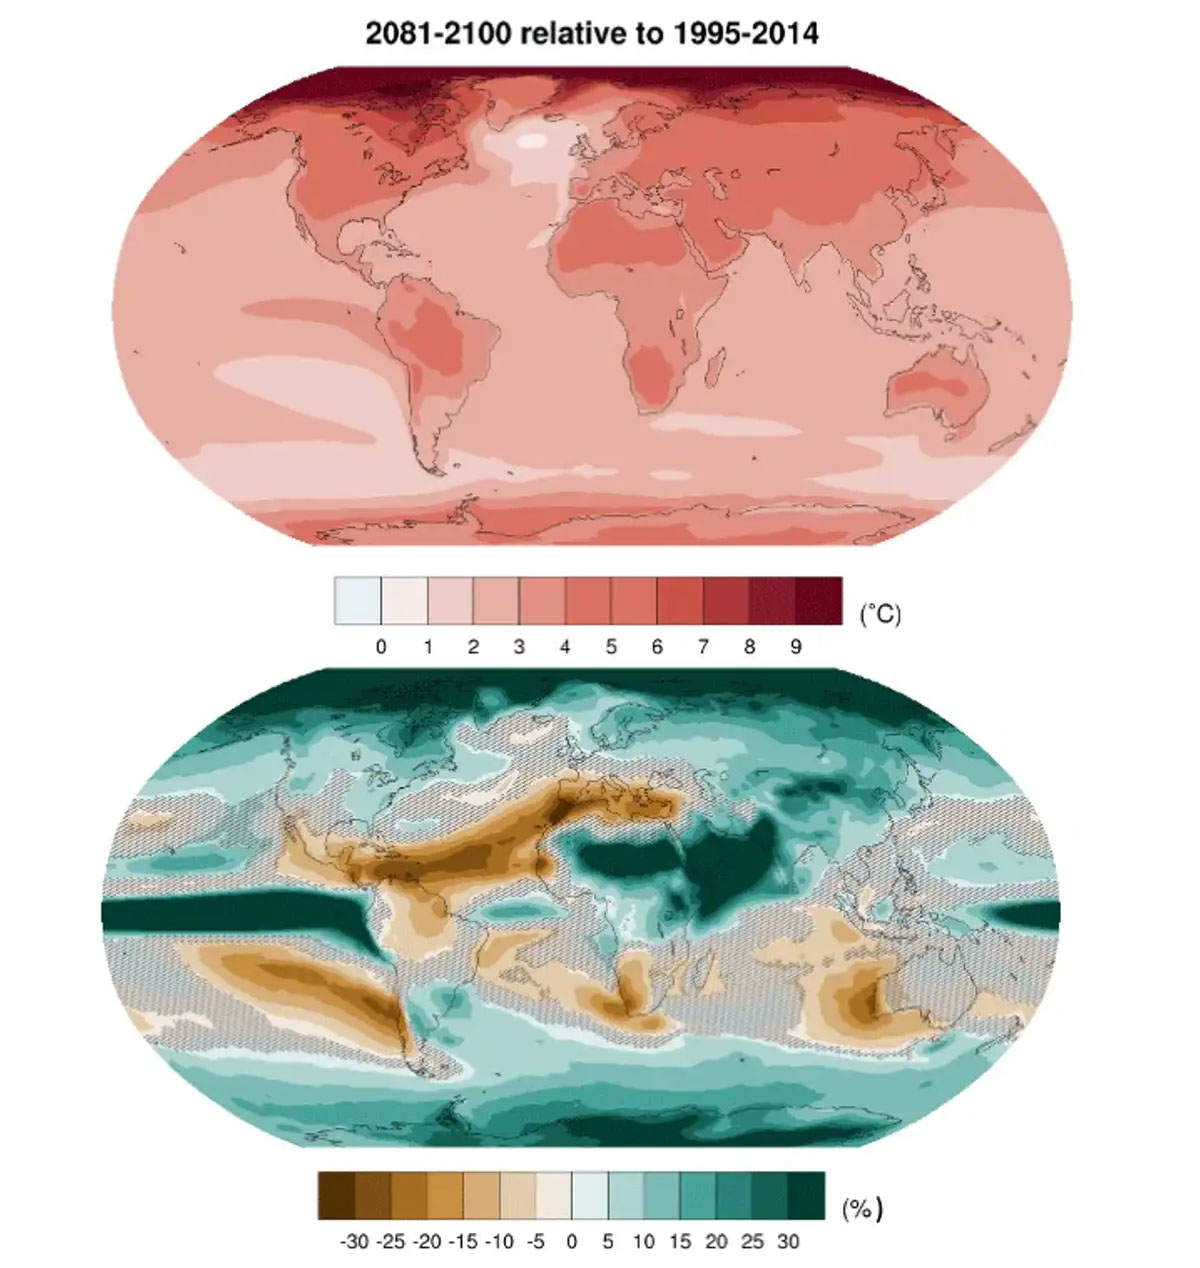
Climate scientists work hard to estimate future changes as a result of increased carbon dioxide and other expected changes, such as world population. It’s clear that temperatures will increase and precipitation will change. The exact magnitude of change depends on many interacting factors.
|
 |
| Temperature and precipitation in a changing world. if the world doesn't take strong actions to reduce greenhouse gases, models indicate there will be higher temperatures worldwide, as the top map shows. The bottom map shows some areas will see more precipitation, while others see less, notably some regions important for agriculture. based on SSPS3-7.0. (Chart: The Conversation/CC-BY-ND Source: Claudia Tebaldi et al., 2021) (click on image to enlarge)
|
A few reasons for hope
|
|
On a hopeful note, scientific research is improving our understanding of climate and the complex Earth system, identifying the most vulnerable areas and guiding efforts to reduce the drivers of climate change. Work on renewable energy and alternative energy sources, as well as ways to capture carbon from industries or from the air, are producing more options for a better prepared society.
|
|
At the same time, people are learning about how they can reduce their own impact, with the growing understanding that a globally coordinated effort is required to have a significant impact. Electric vehicles, as well as solar and wind power, are growing at previously unthinkable rates. More people are showing a willingness to adopt new strategies to use energy more efficiently, consume more sustainably and choose renewable energy.
|
|
Scientists increasingly recognize that shifting away from fossil fuels has additional benefits, including improved air quality for human health and ecosystems.
|