| Sep 06, 2016 |
Detailed age map shows how Milky Way came together
|
|
(Nanowerk News) Using colors to identify the approximate ages of more than 130,000 stars in the Milky Way’s halo, University of Notre Dame astronomers have produced the clearest picture yet of how the galaxy formed more than 13.5 billion years ago.
|
|
Astrophysicist Daniela Carollo, research assistant professor in the Department of Physics at the University of Notre Dame, and Timothy Beers, Notre Dame Chair of Astrophysics, along with research assistant professor Vinicius Placco and their colleagues published their findings in Nature Physics ("The age structure of the Milky Way’s halo"), including a chronographic (age) map that supports a hierarchical model of galaxy formation. That model, developed by theoreticians over the past few decades, suggests that the Milky Way formed by merging and accretion of small mini-halos containing stars and gas, and that the oldest of the Milky Way's stars are at the center of the galaxy and younger stars and galaxies merged with the Milky Way, drawn in by gravity over billions of years.
|
|
"We haven't previously known much about the age of the most ancient component of the Milky Way, which is the Halo System," Carollo says. "But now we have demonstrated conclusively for the first time that ancient stars are in the center of the galaxy and the younger stars are found at longer distances. This is another piece of information that we can use to understand the assembly process of the galaxy, and how galaxies in general formed."
|
|
Using data from the Sloan Digital Sky Survey, in which Notre Dame is a partner, the scientists identified more than 130,000 blue horizontal-branch stars, which burn helium in their cores, and exhibit different colors based on their ages. They are the only type of star whose age can be estimated by color alone. The technique they employed is one that Beers helped develop about 25 years ago when he was still a postdoctoral fellow.
|
|
The mapped stars show a clear hierarchy, with the oldest stars near the center of the galaxy, and younger stars further away.
|
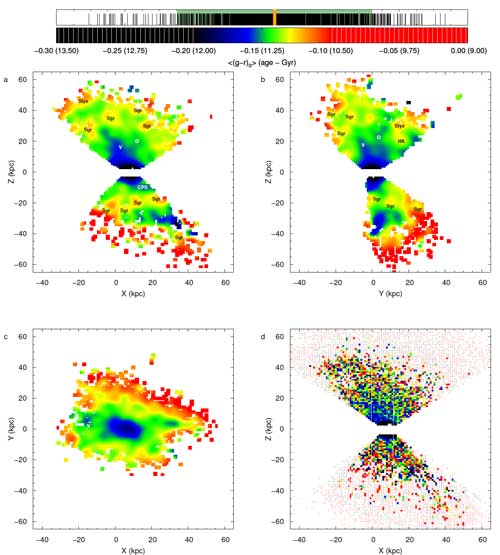 |
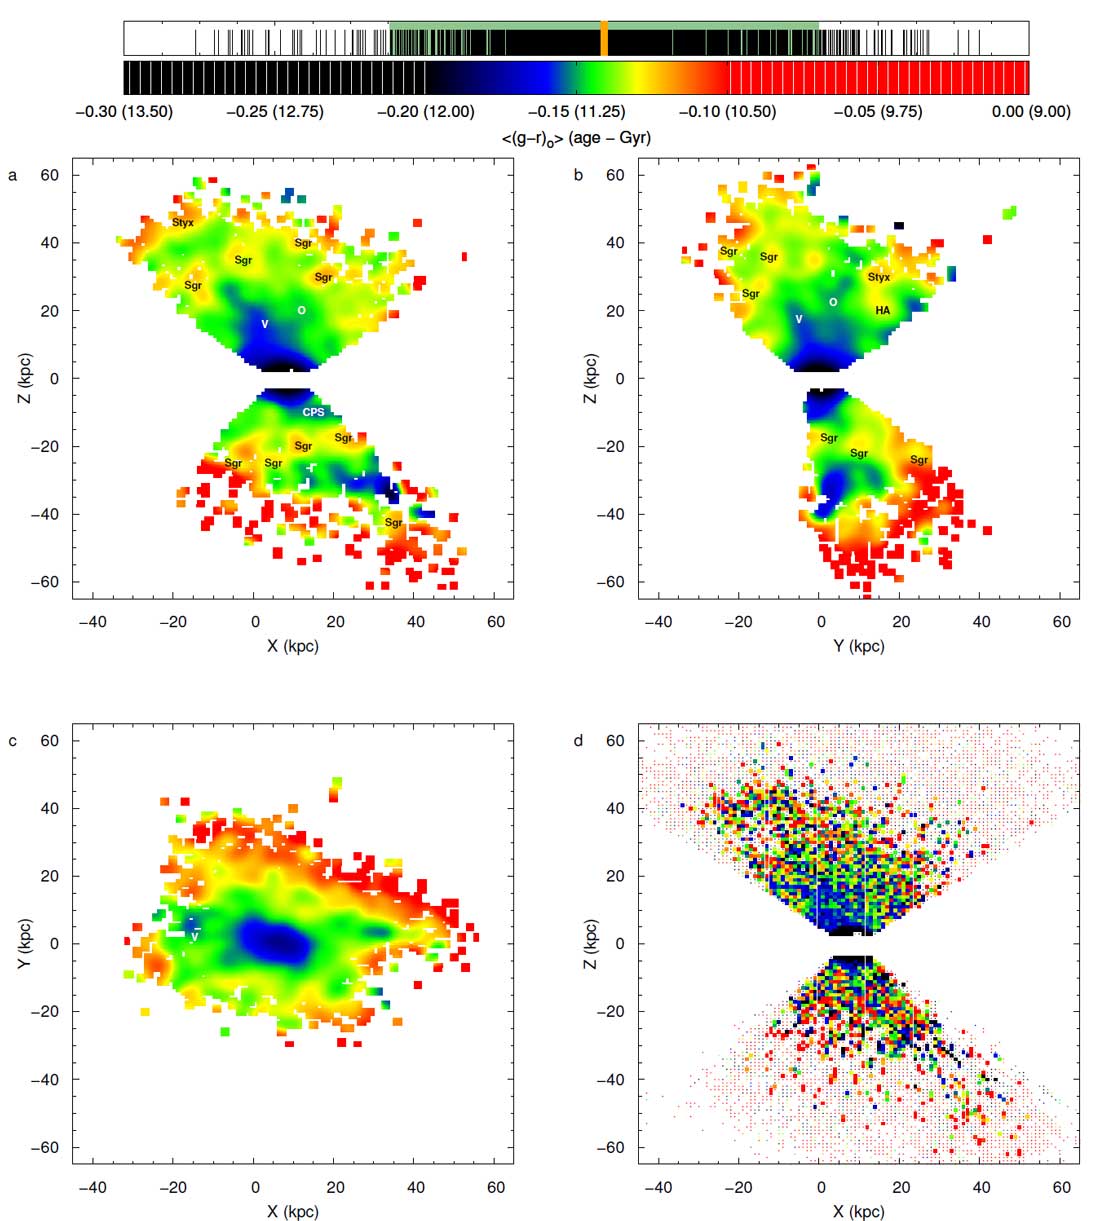
| Chronographic map for photometrically-selected BHB stars from the SDSS. The adopted Cartesian reference system is left-handed, having positive X towards the anti-center of the Galaxy. The location at (0,0,0) kpc corresponds to the center of the Galaxy, and the Sun is located at (X,Z) = (8.5,0,0) kpc. a, The distribution of stars in the (X,Z) plane in a square grid of 1 kpc pixels smoothed with a Gaussian kernel (of width 3 kpc) applied to the accepted pixels. The colour (age) scale is shown at the top of the diagram. The numbers in parentheses are the corresponding ages in Gyr. The orange bar is the median value of the pixels; the green-shaded area indicates the +/– 2δ dispersion region. b,c, Colour (age) maps in the (Y,Z) plane and (X,Y) plane, respectively. Previously known structures and over-densities are marked in panels a-c with black or white characters with the following meaning: Sgr: Sagittarius Stream, V: Virgo over-density, O: Orphan Stream, Styx: Styx Stream, CPS: Cetus Polar Stream, HA: Hercules-Aquila cloud. d, The distribution of stars in the (X,Z) plane in a square grid of 1 kpc pixels. The filled squares indicate pixels with at least 10 BHB stars (accepted pixels); the colour represents the mean (g – r)0 colour for each pixel. The filled dots are pixels with less than 10 stars. The shape of the distribution reflects the selection of stars in Galactic latitude (|b| ≥ 35o). (click on image to enlarge)
|
|
"The colors, when the stars are at that stage of their evolution, are directly related to the amount of time that star has been alive, so we can estimate the age," Beers says. "Once you have a map, then you can determine which stars came in first and the ages of those portions of the galaxy. We can now actually visualize how our galaxy was built up and inspect the stellar debris from some of the other small galaxies being destroyed by their interaction with ours during its assembly."
|
|
Carollo explains that initial gas clouds containing primordial material, such as hydrogen and helium, formed the first stars. Clouds with various masses and gas content behaved differently: the smaller clouds formed one or two generation of stars (older objects) and then merged with other clouds and ended in the center of the galaxy pulled in by gravity, while larger mass clouds formed multiple generation of stars (younger objects) before they merged.
|
|
Still larger galaxies, such as the Milky Way, grew as their gravity pulled in and forced mergers with these smaller galaxies.
|
|
Today, it is only possible to use these techniques in our own galaxy and in the dwarf satellite galaxies that surround the Milky Way. But, the James Webb Space Telescope, set to be launched in 2018, is expected to gather much more data from distant galaxies, including the first glows from the Big Bang. Using the aging method that Beers' Galactic Archaeology group at Notre Dame employed, that data can fill in pieces of the puzzle on our own galaxy's formation, as well as questions about how the universe came into being.
|
|
Astrophysicist Daniela Carollo, research assistant professor in the Department of Physics at the University of Notre Dame, and Timothy Beers, Notre Dame Chair of Astrophysics, along with research assistant professor Vinicius Placco and their colleagues published their findings in Nature Physics, including a chronographic (age) map that supports a hierarchical model of galaxy formation. That model, developed by theoreticians over the past few decades, suggests that the Milky Way formed by merging and accretion of small mini-halos containing stars and gas, and that the oldest of the Milky Way's stars are at the center of the galaxy and younger stars and galaxies merged with the Milky Way, drawn in by gravity over billions of years.
|
|
"We haven't previously known much about the age of the most ancient component of the Milky Way, which is the Halo System," Carollo says. "But now we have demonstrated conclusively for the first time that ancient stars are in the center of the galaxy and the younger stars are found at longer distances. This is another piece of information that we can use to understand the assembly process of the galaxy, and how galaxies in general formed."
|
|
Using data from the Sloan Digital Sky Survey, in which Notre Dame is a partner, the scientists identified more than 130,000 blue horizontal-branch stars, which burn helium in their cores, and exhibit different colors based on their ages. They are the only type of star whose age can be estimated by color alone. The technique they employed is one that Beers helped develop about 25 years ago when he was still a postdoctoral fellow.
|
|
The mapped stars show a clear hierarchy, with the oldest stars near the center of the galaxy, and younger stars further away.
|
|
"The colors, when the stars are at that stage of their evolution, are directly related to the amount of time that star has been alive, so we can estimate the age," Beers says. "Once you have a map, then you can determine which stars came in first and the ages of those portions of the galaxy. We can now actually visualize how our galaxy was built up and inspect the stellar debris from some of the other small galaxies being destroyed by their interaction with ours during its assembly."
|
|
Carollo explains that initial gas clouds containing primordial material, such as hydrogen and helium, formed the first stars. Clouds with various masses and gas content behaved differently: the smaller clouds formed one or two generation of stars (older objects) and then merged with other clouds and ended in the center of the galaxy pulled in by gravity, while larger mass clouds formed multiple generation of stars (younger objects) before they merged.
|
|
Still larger galaxies, such as the Milky Way, grew as their gravity pulled in and forced mergers with these smaller galaxies.
|
|
Today, it is only possible to use these techniques in our own galaxy and in the dwarf satellite galaxies that surround the Milky Way. But, the James Webb Space Telescope, set to be launched in 2018, is expected to gather much more data from distant galaxies, including the first glows from the Big Bang. Using the aging method that Beers' Galactic Archaeology group at Notre Dame employed, that data can fill in pieces of the puzzle on our own galaxy's formation, as well as questions about how the universe came into being.
|